On this page
Business students often meet statistics as a formula list. Professional work begins one step earlier: deciding what a row represents and whether the available records can answer the question. This module keeps that source contract attached to every number.
Sequence and rationale
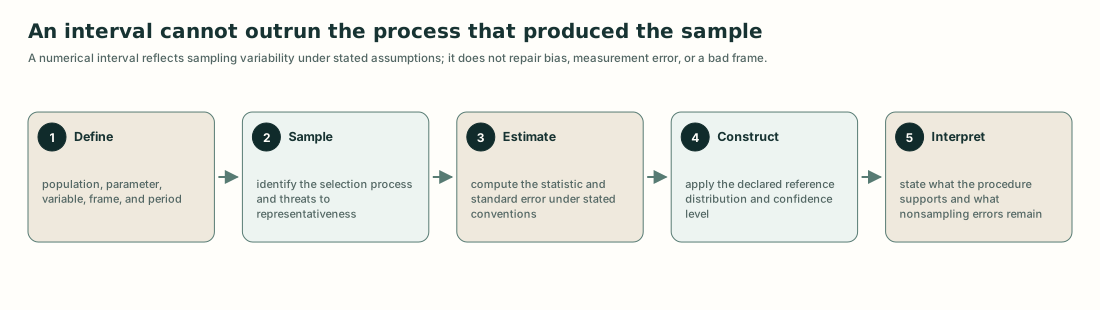
- Define the data and sample. Establish the unit, variables, population, frame, selection design, scale, cutoff, and nonsampling-error controls.
- Describe the distribution. Inspect ordered values before compressing them into center and spread; investigate the retained tail observation.
- Connect statistics to sampling variation. Separate known sample summaries from unknown population quantities and distinguish standard deviation from standard error.
- Build and challenge a confidence interval. Reproduce a supplied-t mean interval, interpret procedure coverage, and expose assumptions the engine cannot validate.
- Write an evidence-bound conclusion. Preserve separate descriptive, estimation, causal, forecasting, risk, valuation, accounting-control, and decision claims.
Accounting learners repeatedly trace invoice IDs, issue and settlement dates, classifications, completeness, uniqueness, cutoff, joins, and reconciliation. Finance learners receive the same controlled data, then practice resisting the move from a historical sample difference to a risk forecast, valuation input, or policy recommendation. Undergraduates work from visible values and reconciled formulas. Graduate learners use explicit challenge checkpoints and the cumulative case to identify clustering, target drift, tail behavior, frame coverage, dependence, and estimand problems; computing cluster-adjusted or two-sample estimators remains outside this foundational module.
Cumulative work
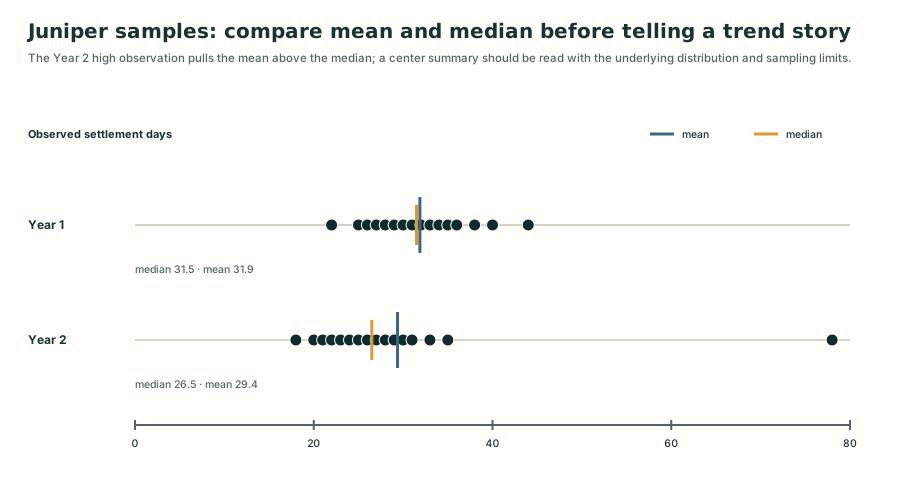
Juniper Wholesale's fictional packet contains two year-specific simple random samples of 16 settled trade invoices. Year 2 has a lower sample mean and median but much greater spread because one source-confirmed 78-day invoice sits beyond the declared upper quartile fence. Students prepare a calculation appendix, an accounting data-control note, and a finance memo that says exactly what the packet supports and what additional evidence would be needed.
Boundaries
The module handles finite univariate series, nominal/ordinal/interval/ratio classification, an explicit median-of-halves quartile convention, population or sample variance denominators, and separate one-sample mean intervals using a supplied Student-t critical value. It excludes two-sample tests, hypothesis testing, regression, time series, portfolio-risk models, forecasting, valuation, causal identification, audit sampling conclusions, accounting estimate measurement, and credential alignment.
The method recomputes arithmetic. It does not prove randomization occurred, the frame is complete, observations are independent, the population is normal, or the recorded dates are correct. Those are evidence questions.
Module outcomes
Define a business-data question through its observational unit, variables, target population, sampling frame, selection design, measurement scales, source, period, and cutoff.
Inspect a univariate distribution and compute means, medians, quartiles, ranges, sample or population variance, and standard deviation under explicit conventions.
Investigate unusual observations against source evidence and preserve a documented correction, retention, segmentation, or exclusion decision.
Distinguish sample statistics, population parameters, sampling variability, observation spread, standard error, margin of error, and nonsampling error.
Construct and interpret a supplied-critical-value two-sided one-sample Student-t interval for a population mean while challenging its design and condition assumptions.
Write separate accounting-control and finance-analysis conclusions that distinguish description, estimation, association, cause, forecast, risk, valuation, decision, and next evidence.
Learning sequence
Follow the dependency order, or open the lesson you need.
Capstone and summative assessment
Use the cumulative case first, then test each transfer without exposing answer keys.
Summative sequence
8 scored decisions- Separate Juniper's target, frame, and sample
- Match Juniper fields to measurement scales
- Choose a complete Year 2 distribution description
- Disposition a valid quartile-fence flag
- Choose the sample-variance denominator
- Distinguish Year 1 standard deviation from standard error
- Interpret a realized 95% interval
- Stop Juniper's conclusion at the evidence boundary