Detailed visual description
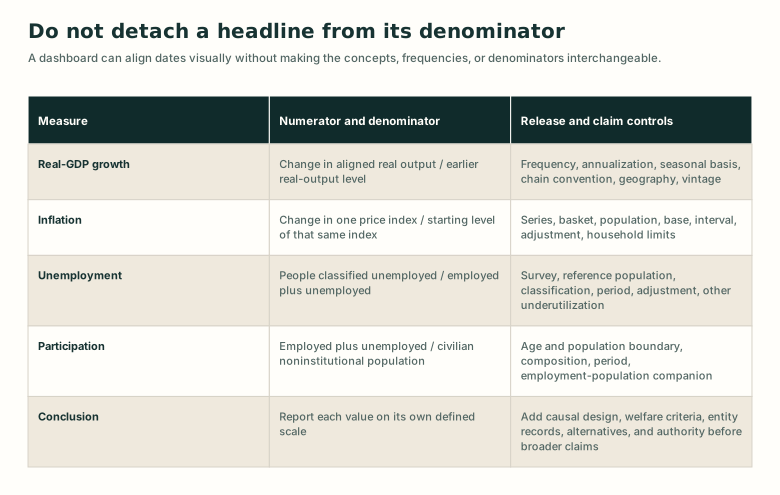
Real-GDP growth uses an earlier real-output level. Inflation uses the starting value of the same price index. Unemployment uses the labor force, while participation uses the civilian noninstitutional population. Each row adds frequency, adjustment, population, and release-vintage controls. The final row warns that causal, welfare, accounting, and decision conclusions require separate evidence.
Review apparatus
Visual provenance and review
- Technique
- deterministic svg
- Role
- explanatory
- Review state
- candidate
- Rights
- CC0-1.0 · Project-authored deterministic teaching diagram
Review notes
- Deterministic first pass; inspect desktop, narrow viewport, grayscale print, and screen-reader adjacent text before acceptance.
- The repeated two-column contract is intentional: learners can compare exact denominator mappings without mistaking a common visual grid for a common measure.
- The 780 by 632 preview was inspected on 2026-08-07; title hierarchy, column widths, alternating rows, wrapping, contrast, and edge spacing were clean with no collision or clipping.