Figure
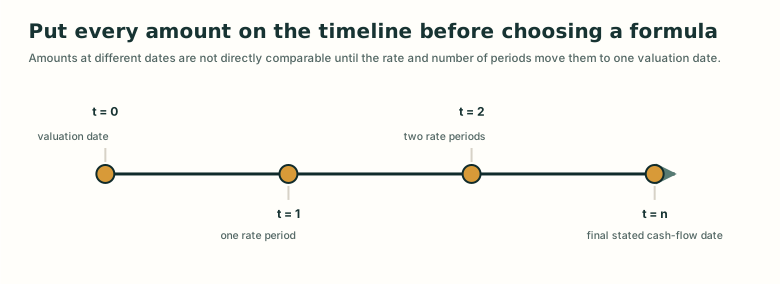
A cash-flow timeline controls time value of money
A timeline that fixes the valuation date, cash flow dates, and rate period alignment before calculation.
Browse the visual explanations used in the course. Each figure includes a text description and information about its source.
Try a broader title, topic, or phrase.
A timeline that fixes the valuation date, cash flow dates, and rate period alignment before calculation.
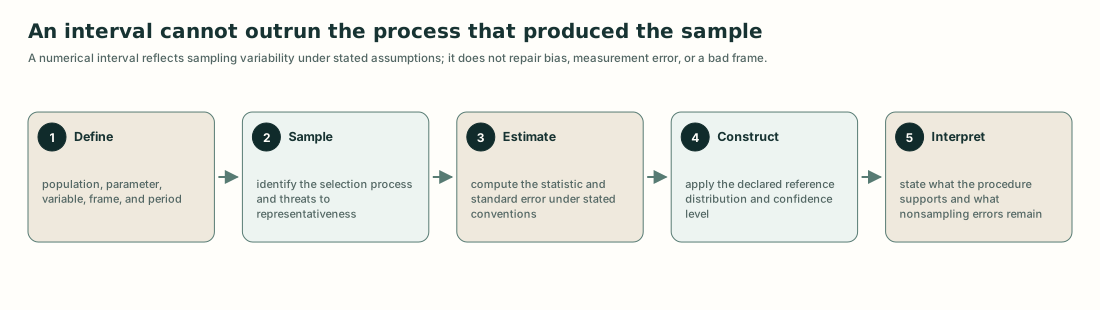
A flow from population question and sampling design through estimate, standard error, interval, and bounded interpretation.
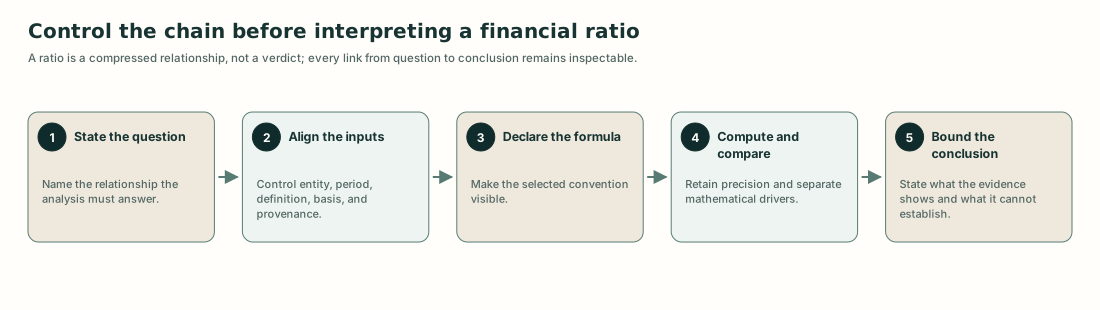
A model proposed and deterministically rendered workflow from a stated analytical question to a bounded conclusion.
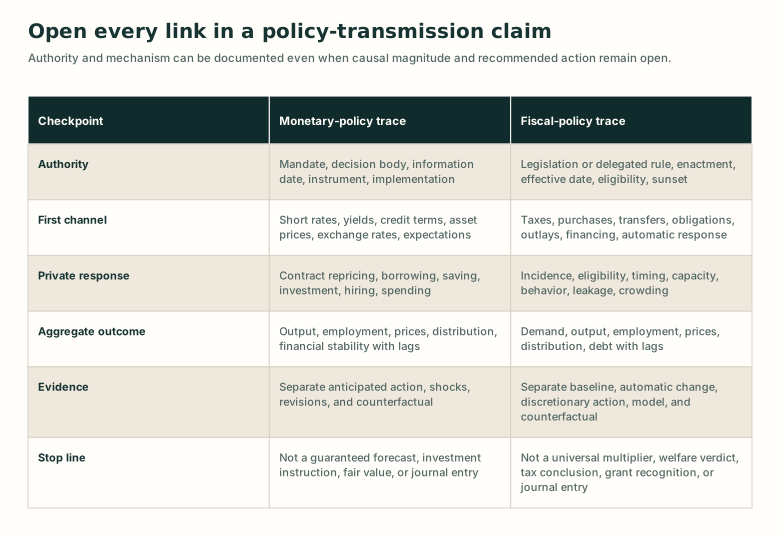
A deterministic comparison table preserving authority, instrument, financial conditions, private response, aggregate outcomes, identification, and decision boundaries.
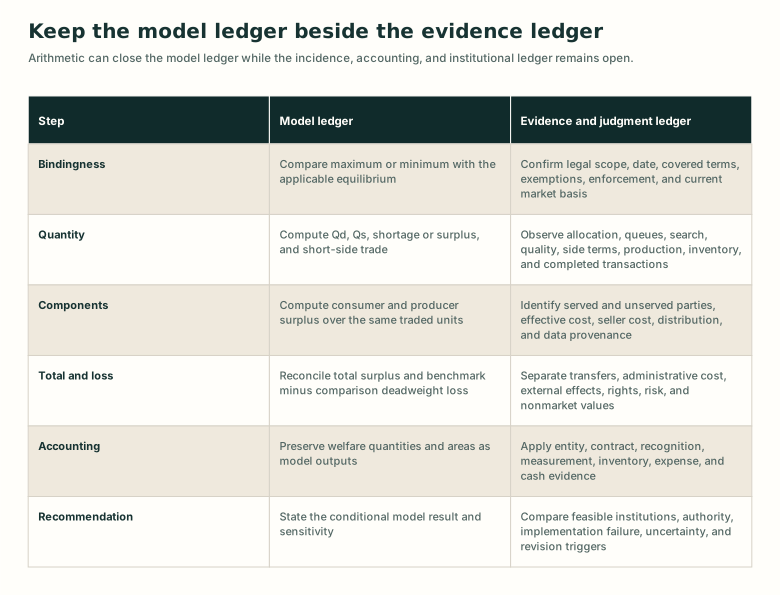
A deterministic comparison of verified market model calculations with the incidence, accounting, distribution, and institutional evidence they do not supply.
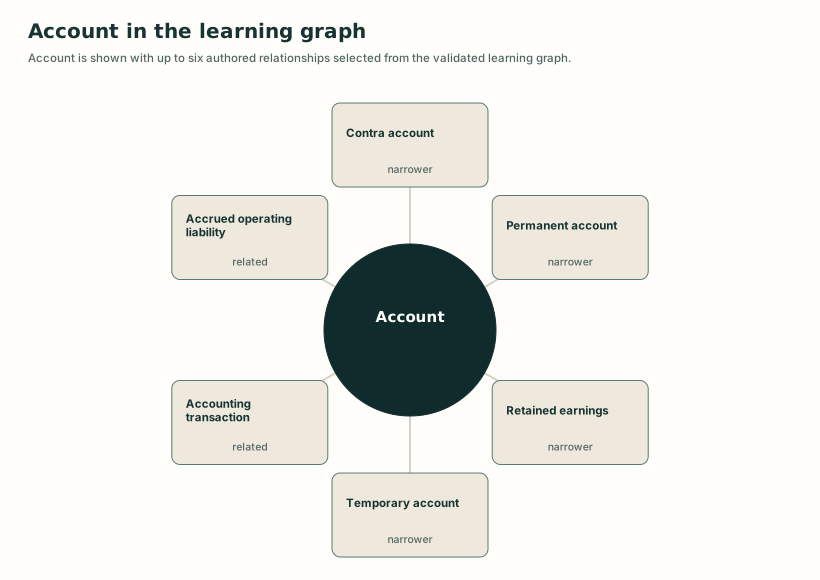
A graph bound structural map connecting Account to authored conceptual, prerequisite, and teaching relationships.
A restrained editorial illustration of a clean reporting surface masking a deliberately distorted evidence trail.
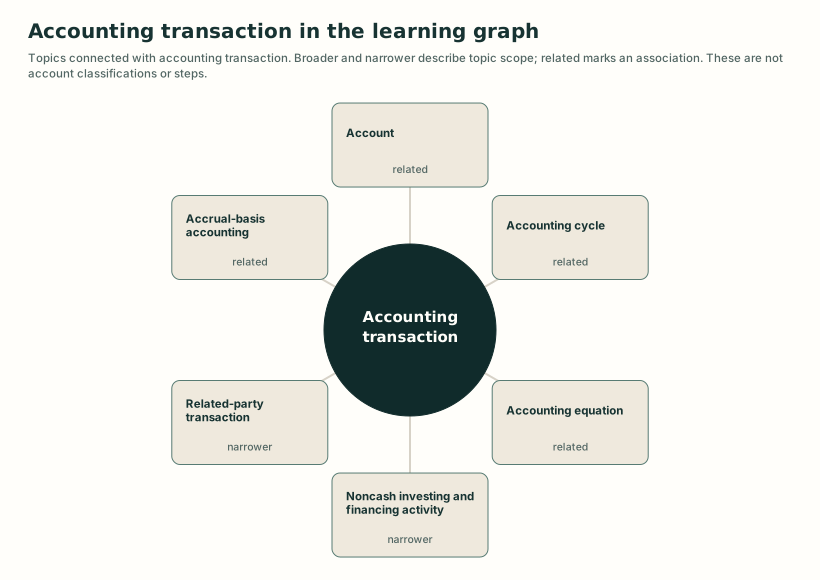
A topic map showing selected connections with accounting transaction.
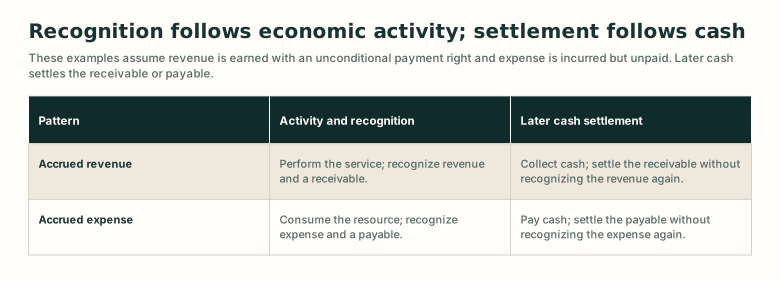
Compare accrued revenue and accrued expense with the later cash transactions that settle them.
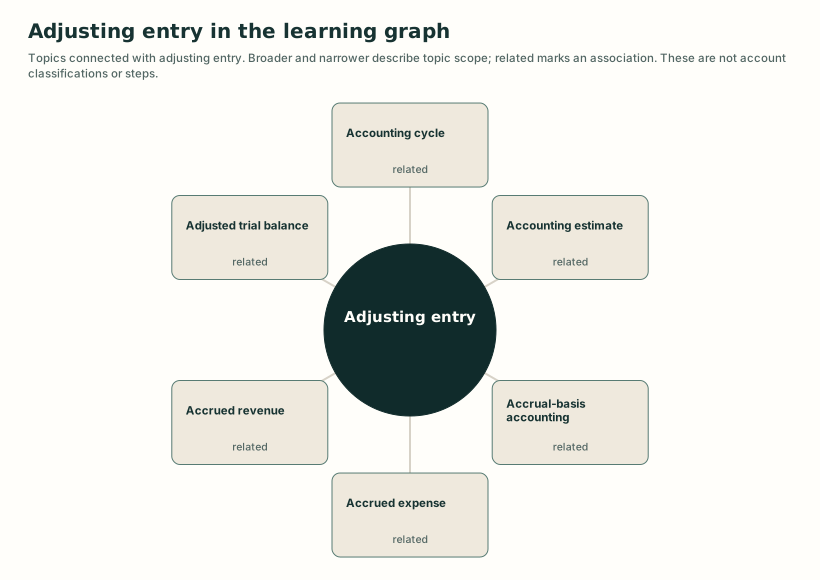
A topic map showing selected connections with adjusting entry.
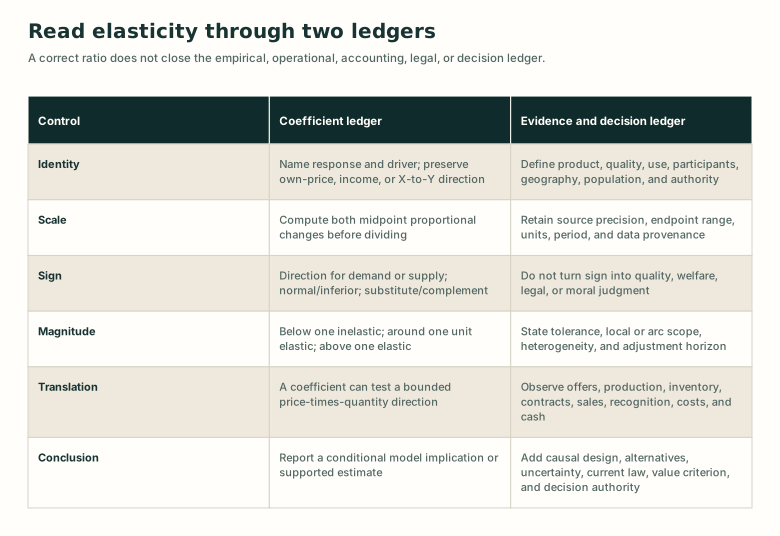
A deterministic control table connecting midpoint arithmetic to the variable, scope, sign, magnitude, evidence, transaction, and decision questions needed for interpretation.
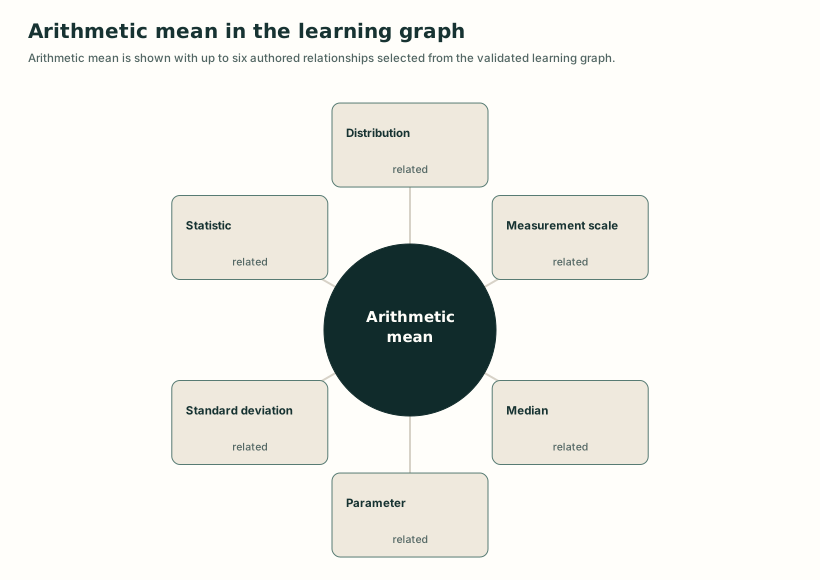
A graph bound structural map connecting Arithmetic mean to authored conceptual, prerequisite, and teaching relationships.
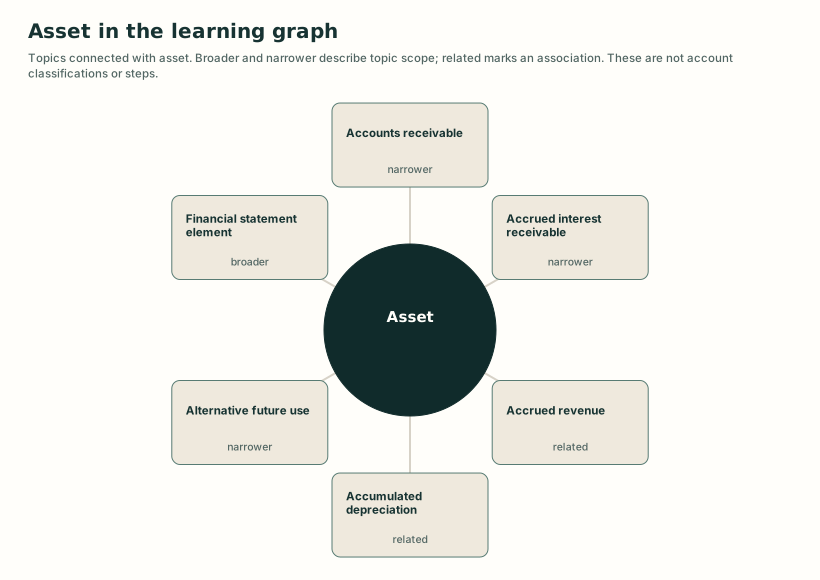
A topic map showing selected connections with asset.
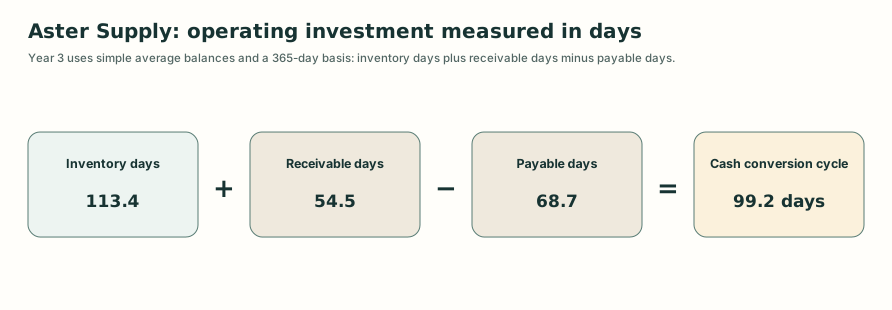
A data bound bridge computing inventory days plus receivable days minus payable days for Aster Supply's third fictional year.
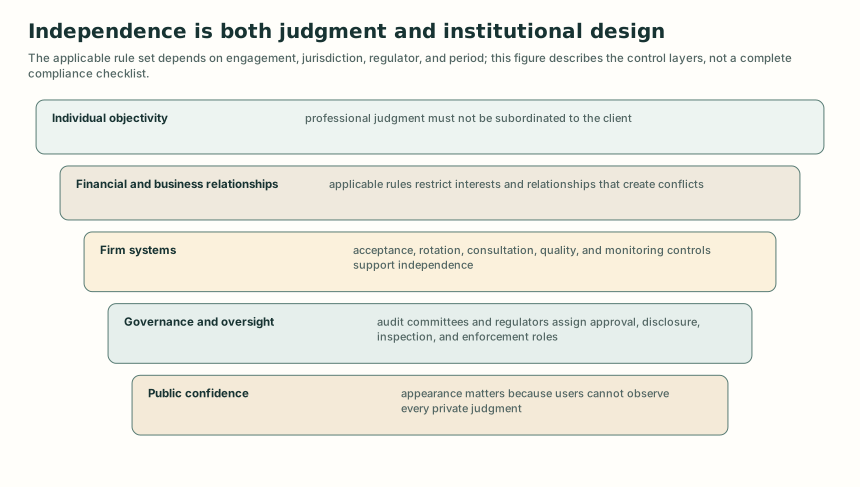
A layered view of individual judgment, prohibited relationships, firm controls, governance oversight, and public confidence.
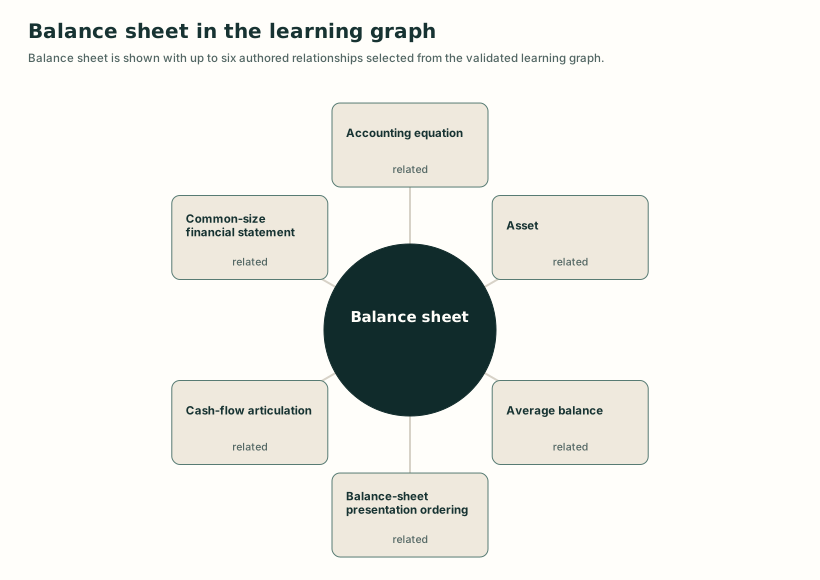
A graph bound structural map connecting Balance sheet to authored conceptual, prerequisite, and teaching relationships.
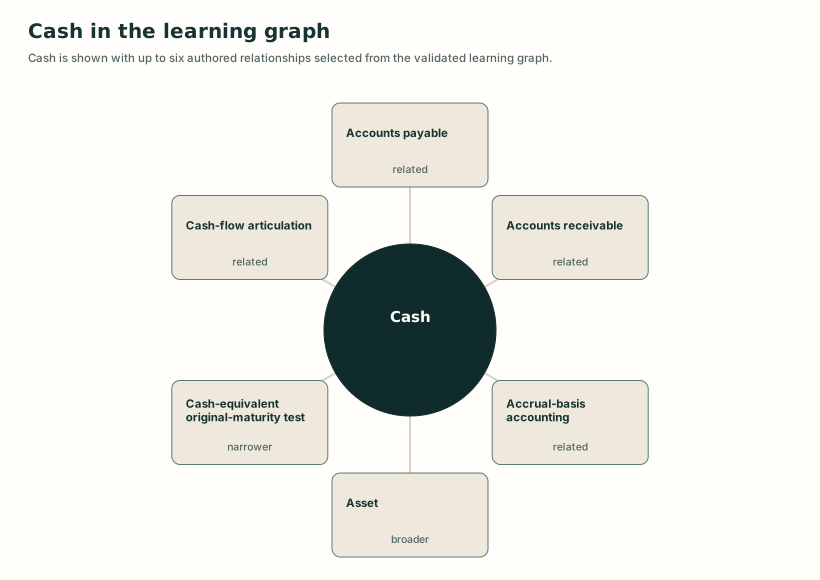
A graph bound structural map connecting Cash to authored conceptual, prerequisite, and teaching relationships.
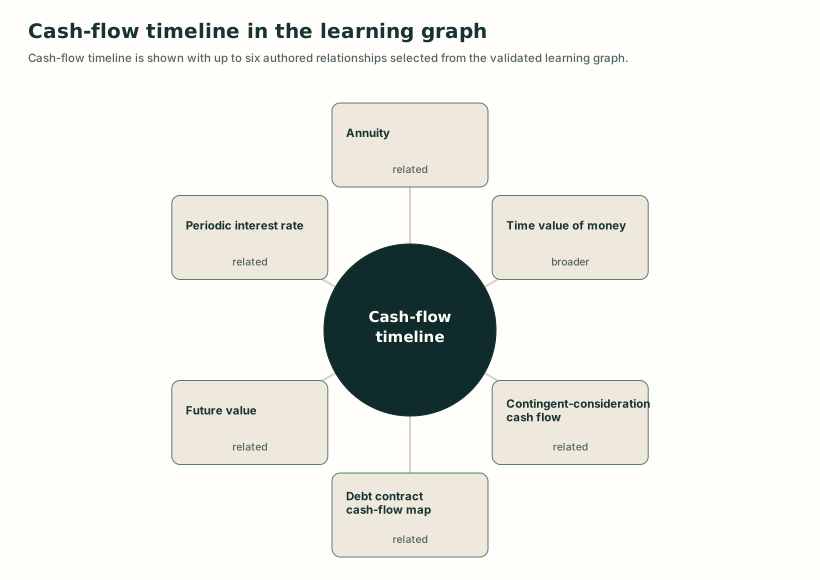
A graph bound structural map connecting Cash flow timeline to authored conceptual, prerequisite, and teaching relationships.
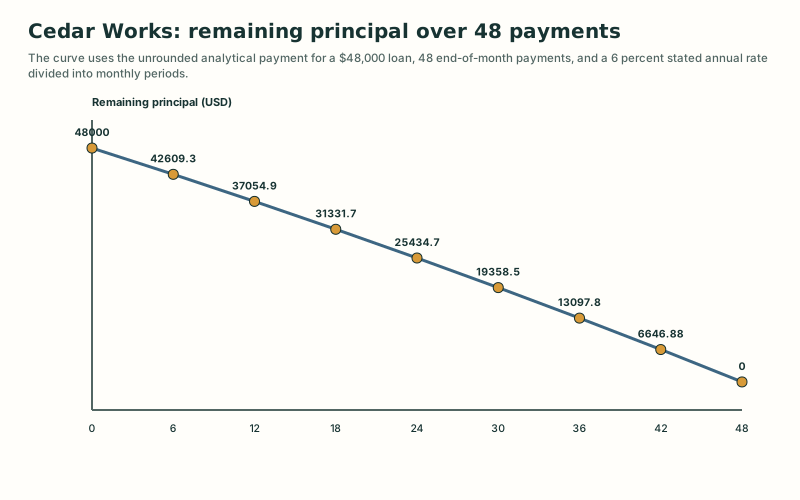
A data bound line chart of the remaining principal under the checked Cedar Works level payment loan assumptions.
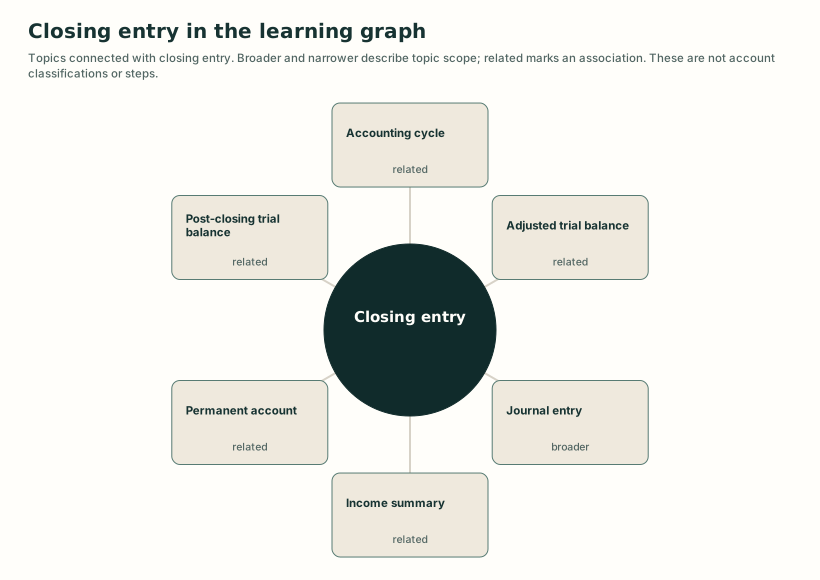
A topic map showing selected connections with closing entry.
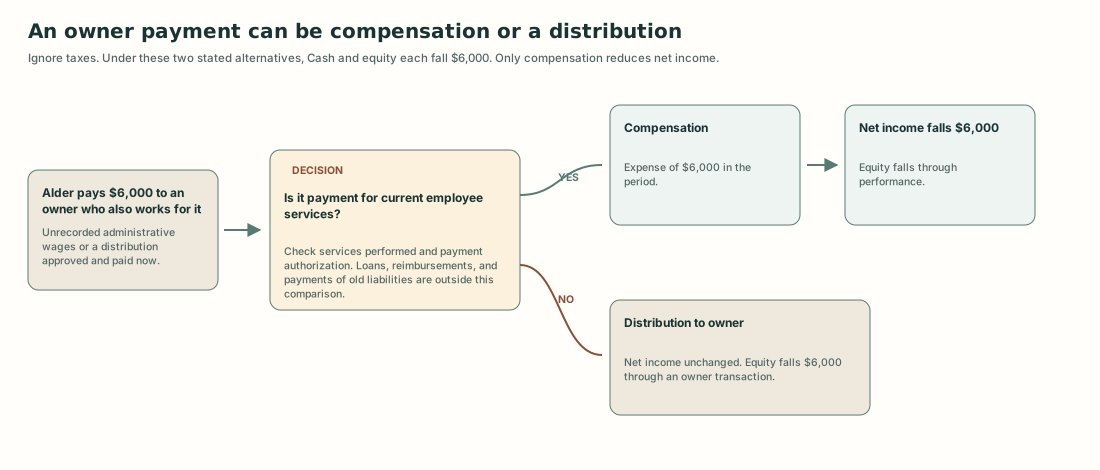
A decision flow for classifying a transfer to a person who is both an owner and the person who performed the work.
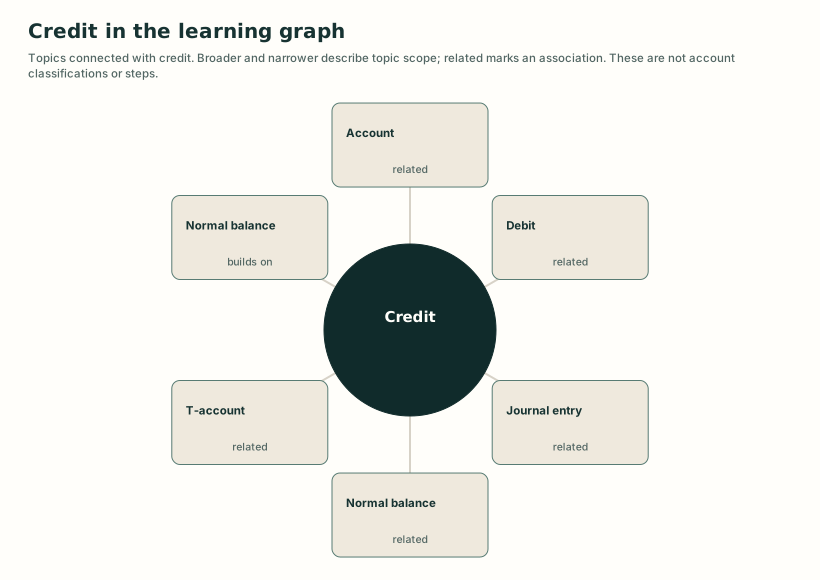
A topic map showing selected connections with credit.
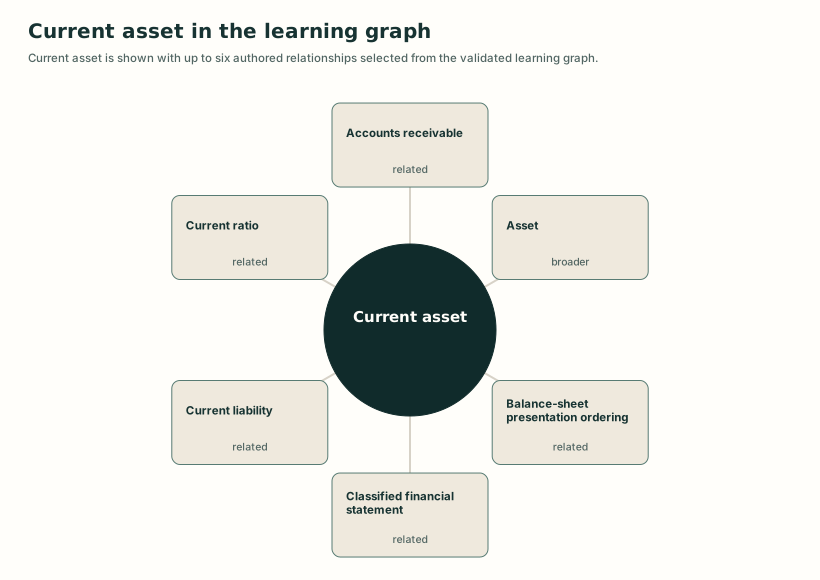
A graph bound structural map connecting Current asset to authored conceptual, prerequisite, and teaching relationships.
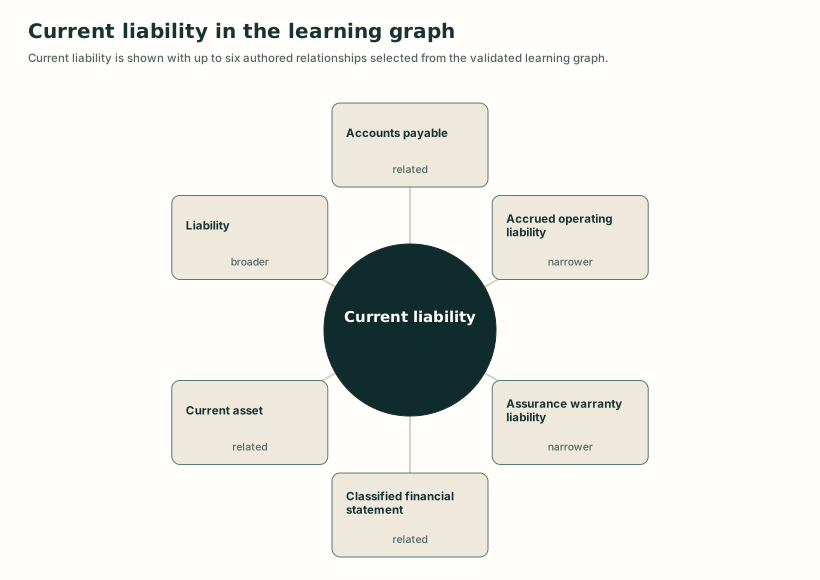
A graph bound structural map connecting Current liability to authored conceptual, prerequisite, and teaching relationships.
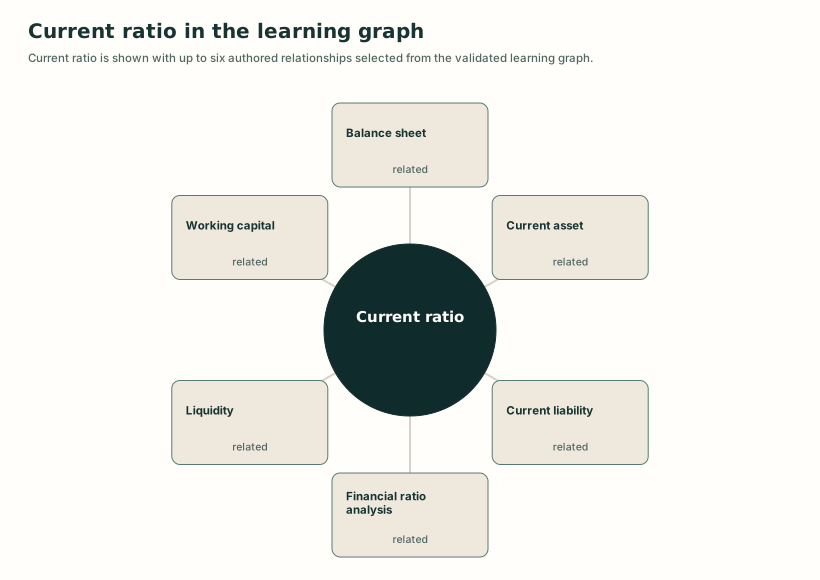
A graph bound structural map connecting Current ratio to authored conceptual, prerequisite, and teaching relationships.
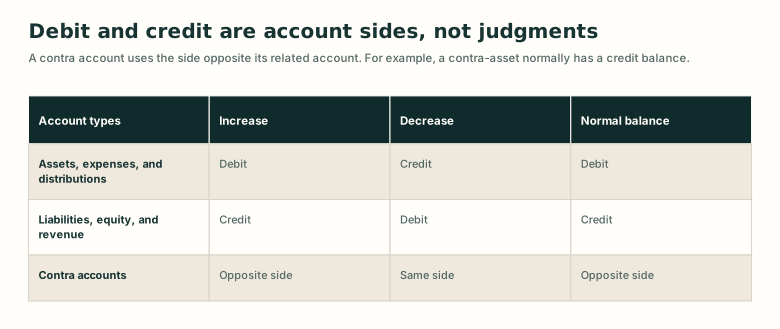
A comparison of debit, credit, and normal balance effects for standard and contra accounts.
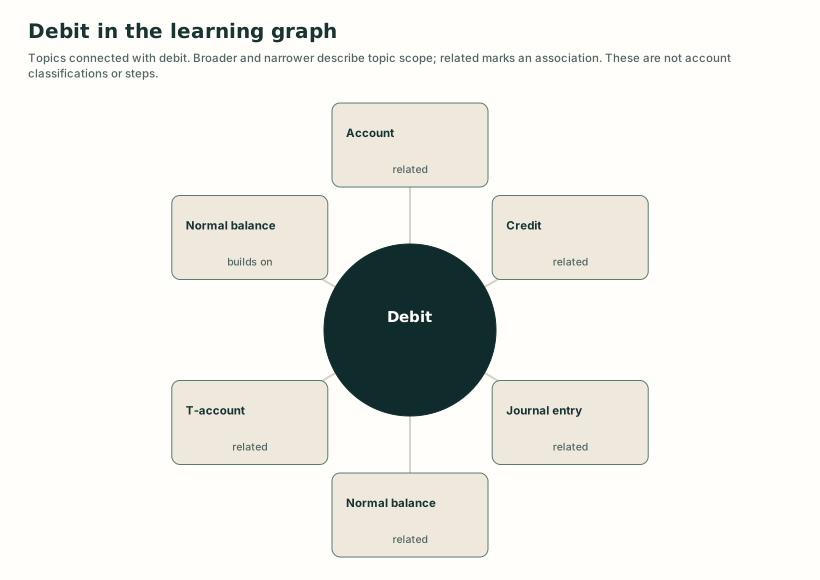
A topic map showing selected connections with debit.
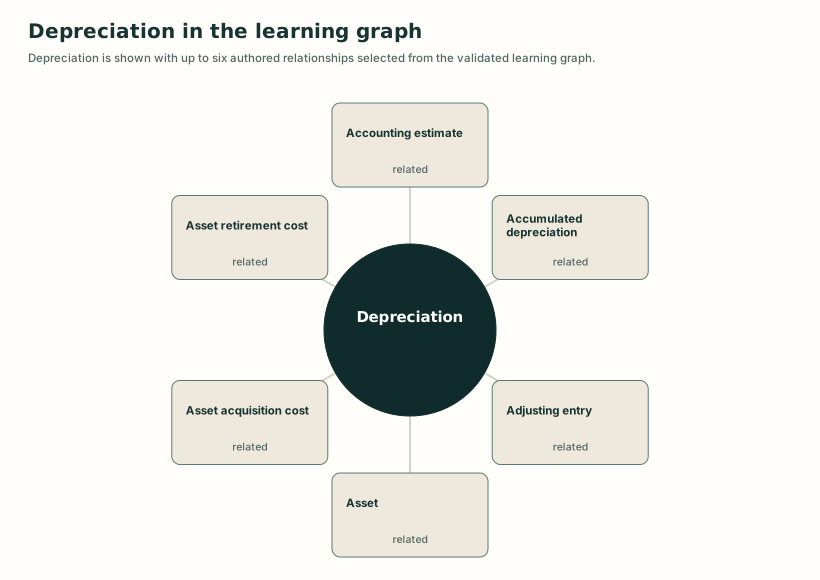
A graph bound structural map connecting Depreciation to authored conceptual, prerequisite, and teaching relationships.
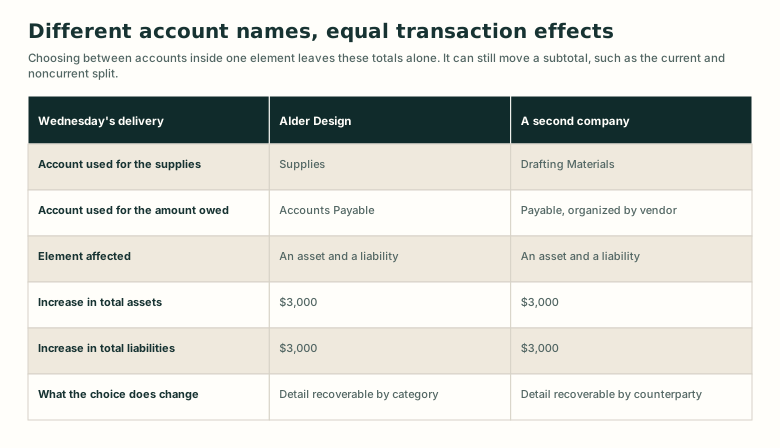
Two companies use different account names for the same purchase and record equal increases in assets and liabilities.
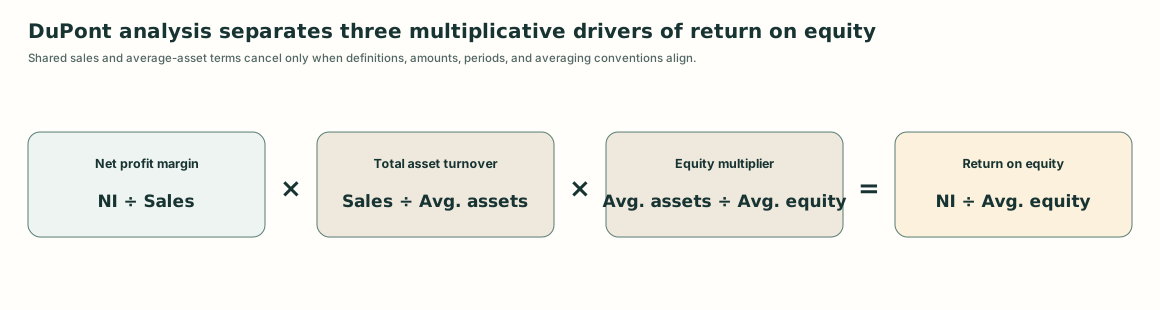
An equation bridge showing how margin, turnover, and leverage multiply to return on equity.
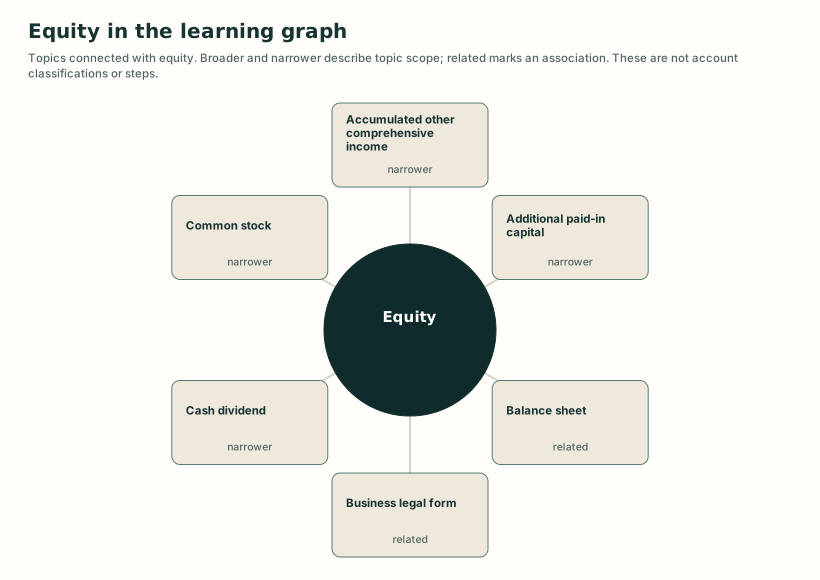
A topic map showing selected connections with equity.
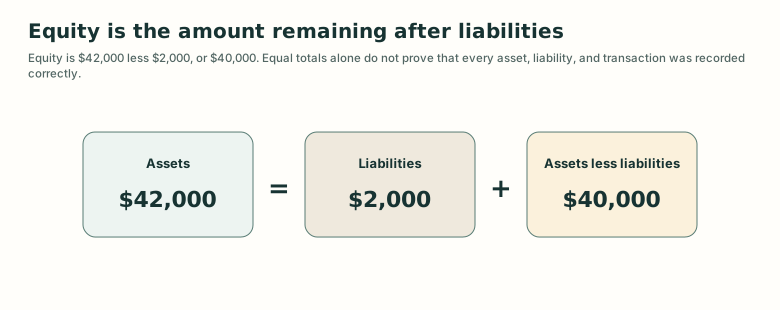
An equation bridge showing that substituting the definition of equity turns the accounting equation into an identity.
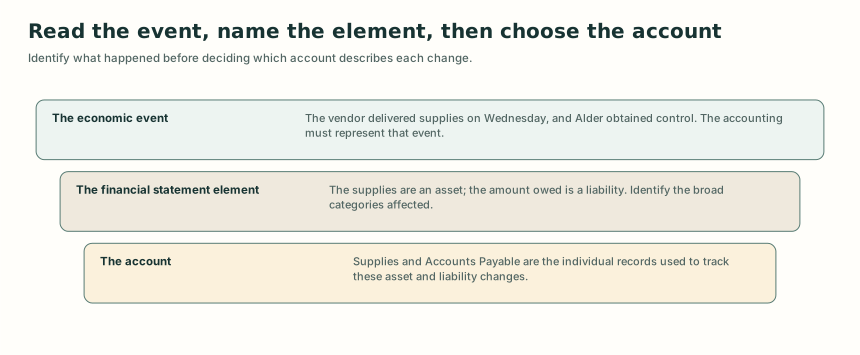
Three nested layers separating what happened from the reporting class it belongs to and the account that preserves the detail.
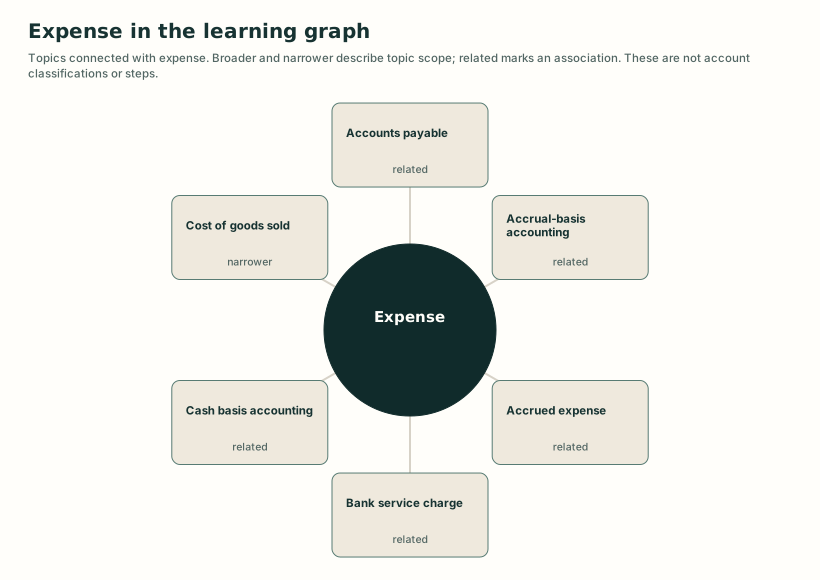
A topic map showing selected connections with expense.
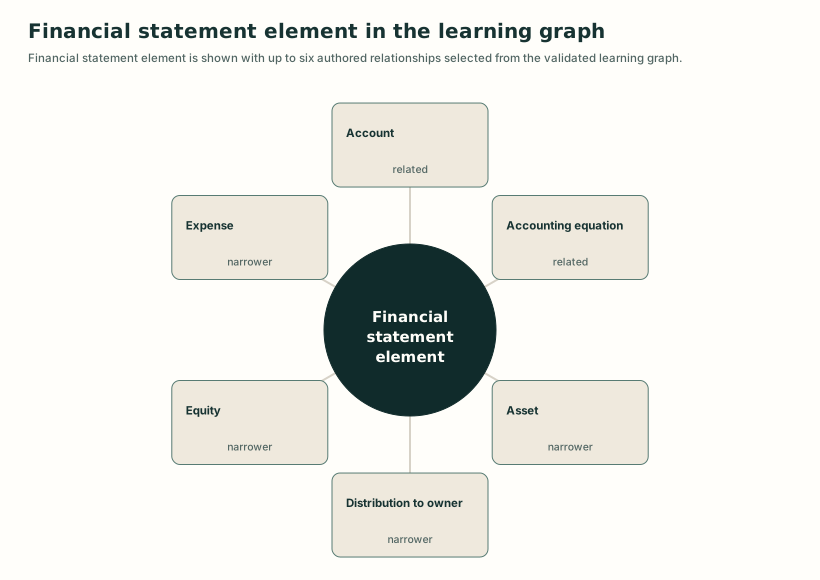
A graph bound structural map connecting Financial statement element to authored conceptual, prerequisite, and teaching relationships.
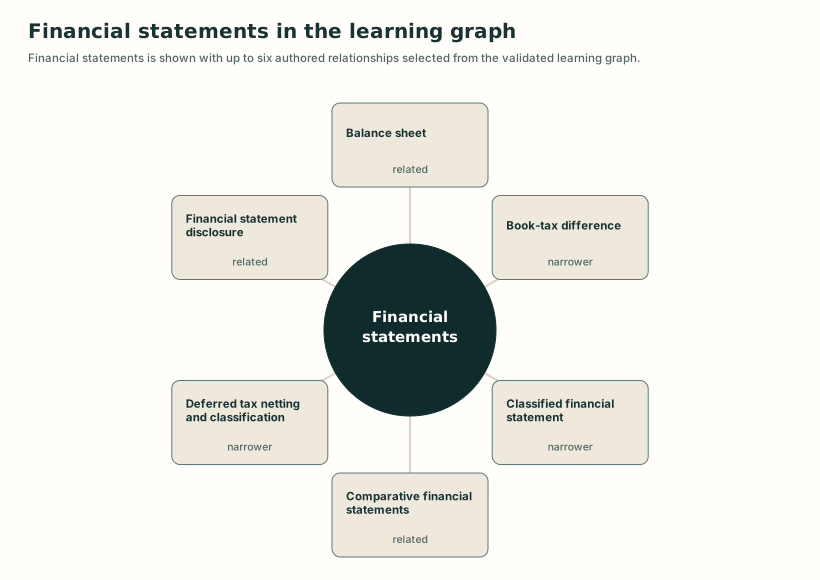
A graph bound structural map connecting Financial statements to authored conceptual, prerequisite, and teaching relationships.
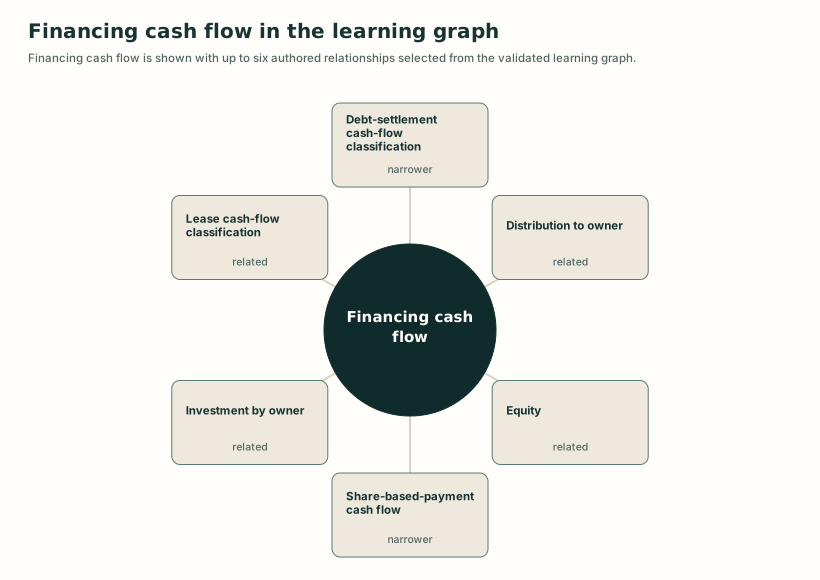
A graph bound structural map connecting Financing cash flow to authored conceptual, prerequisite, and teaching relationships.
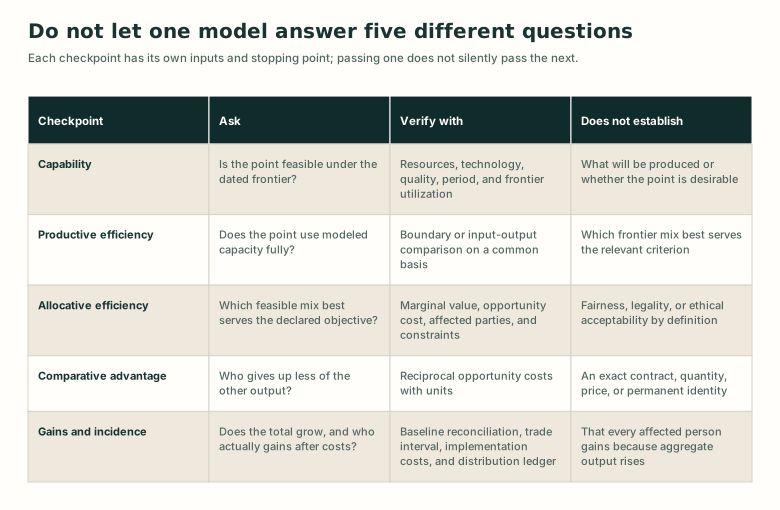
A deterministic comparison that prevents a frontier calculation, efficiency label, or larger modeled total from silently answering a different economic question.
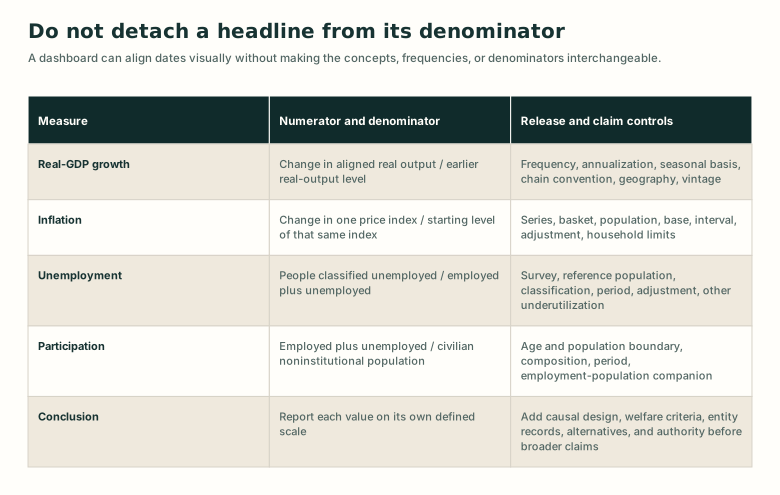
A deterministic comparison table preventing GDP, price index, unemployment, and participation figures from losing their valuation, period, and denominator labels.
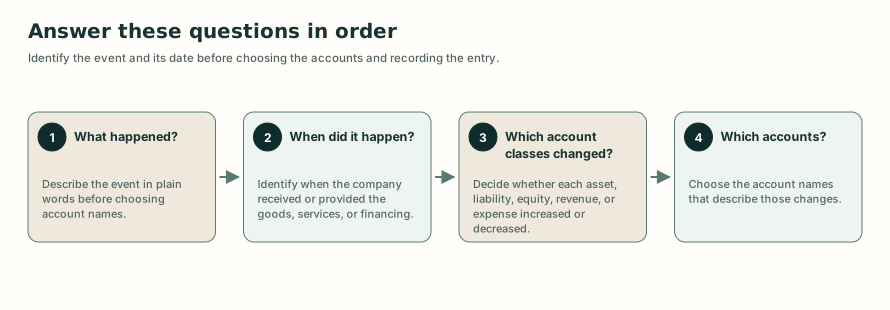
Four questions used to identify the accounts before recording a journal entry.
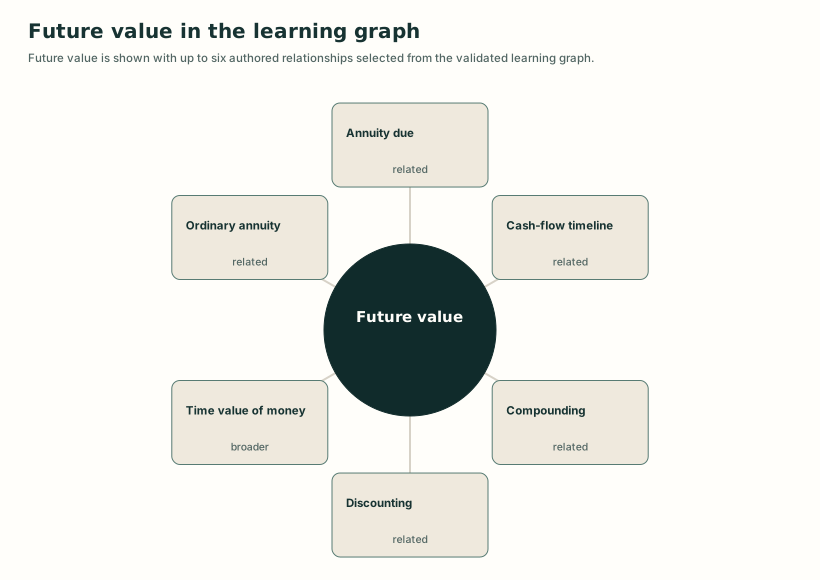
A graph bound structural map connecting Future value to authored conceptual, prerequisite, and teaching relationships.
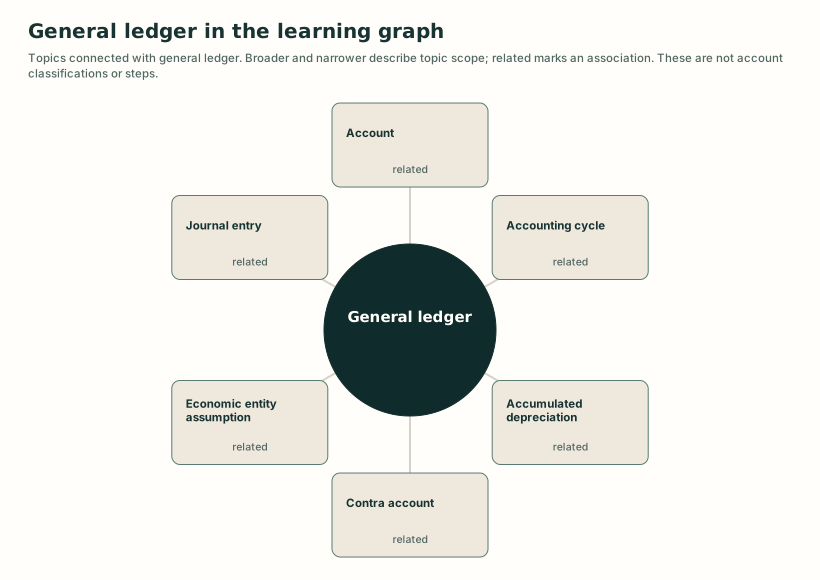
A topic map showing selected connections with general ledger.
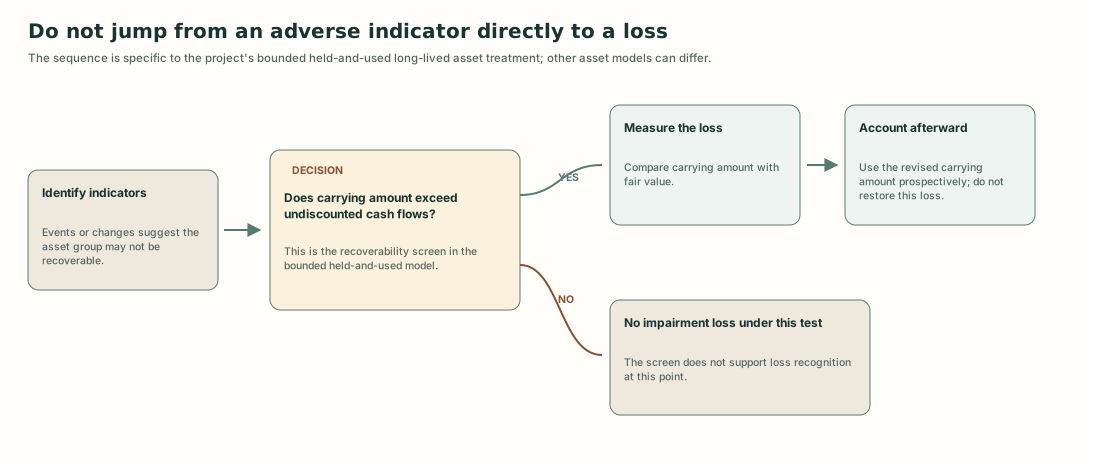
A bounded sequence separating the trigger, recoverability test, measurement, and later accounting.
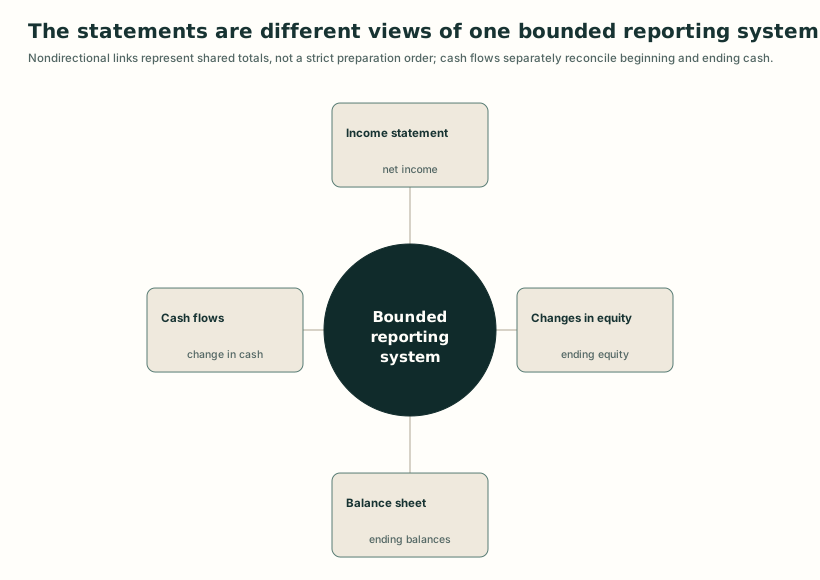
A nondirectional map showing how shared totals connect four primary financial statements.
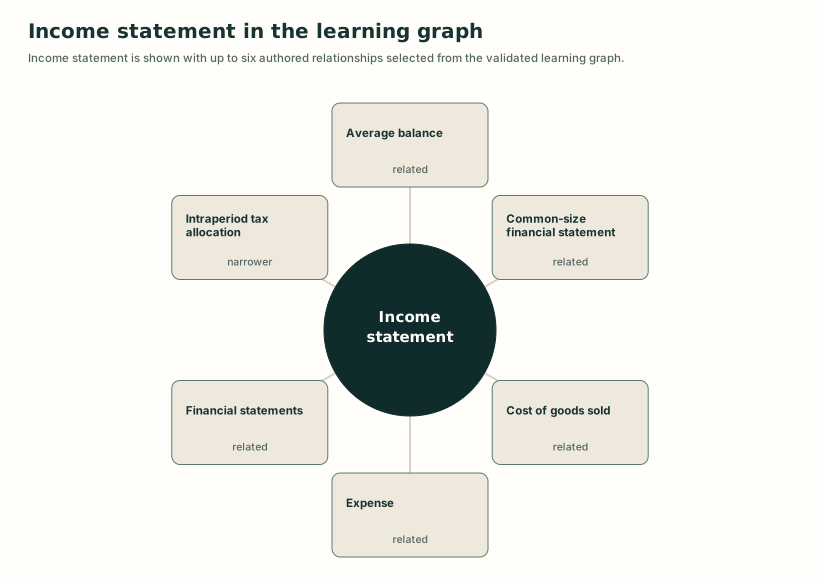
A graph bound structural map connecting Income statement to authored conceptual, prerequisite, and teaching relationships.
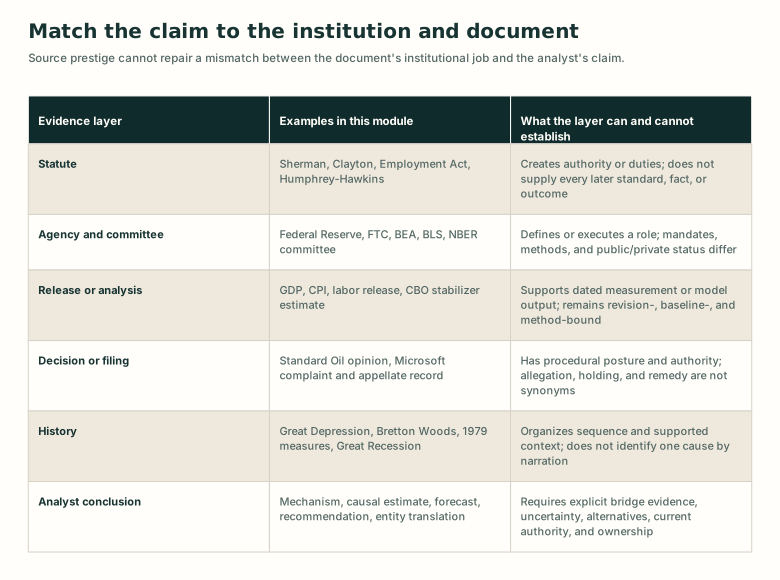
A deterministic map distinguishing statutes, agencies, statistical releases, decisions, historical accounts, and analytical conclusions.
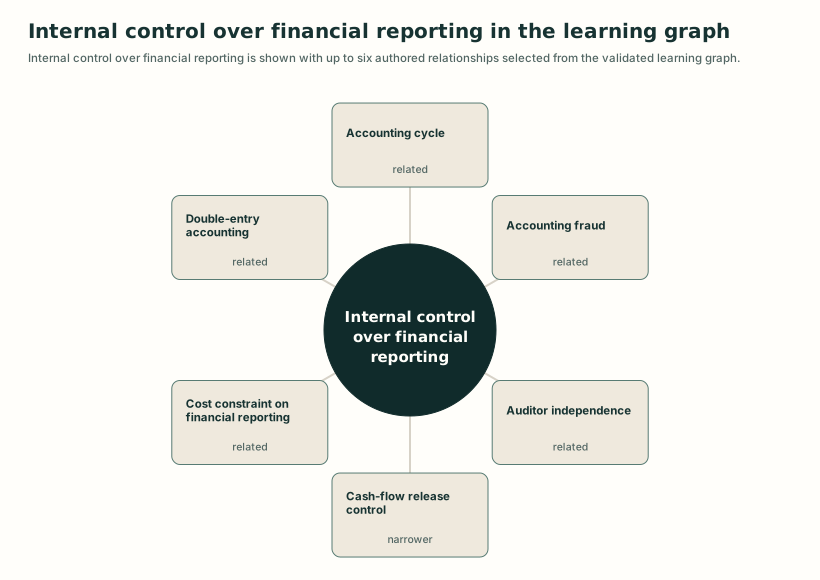
A graph bound structural map connecting Internal control over financial reporting to authored conceptual, prerequisite, and teaching relationships.
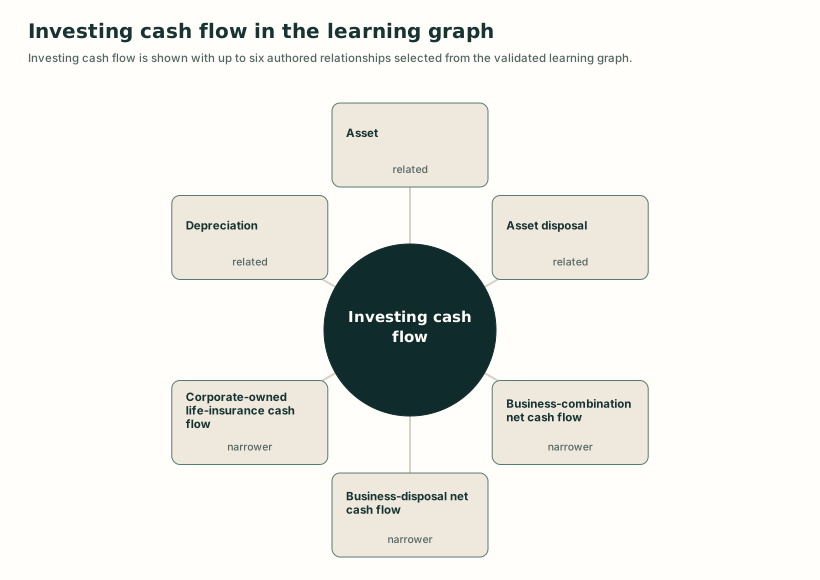
A graph bound structural map connecting Investing cash flow to authored conceptual, prerequisite, and teaching relationships.
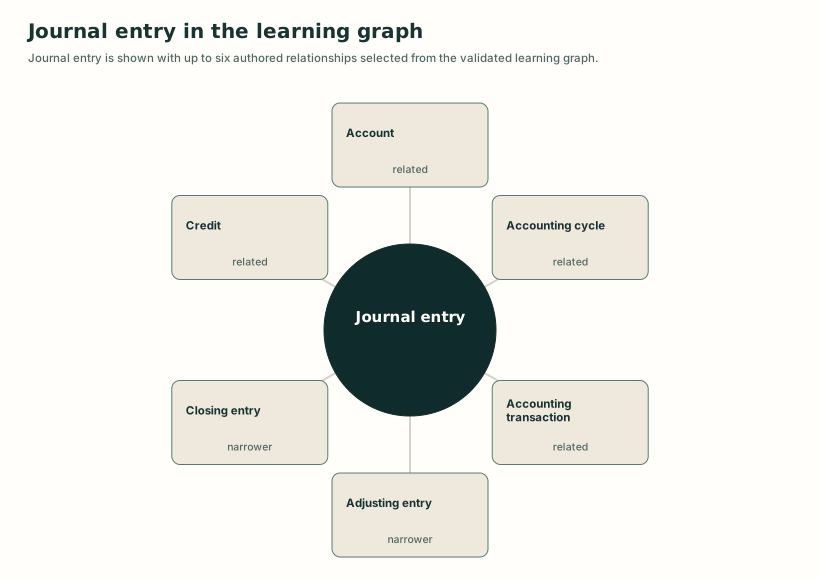
A graph bound structural map connecting Journal entry to authored conceptual, prerequisite, and teaching relationships.
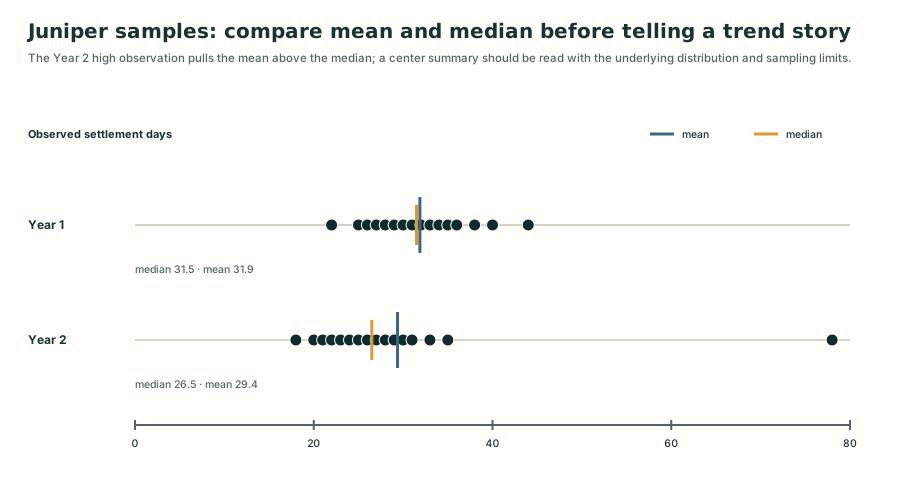
A data bound dot plot exposing every sampled settlement time alongside each year's mean and median.
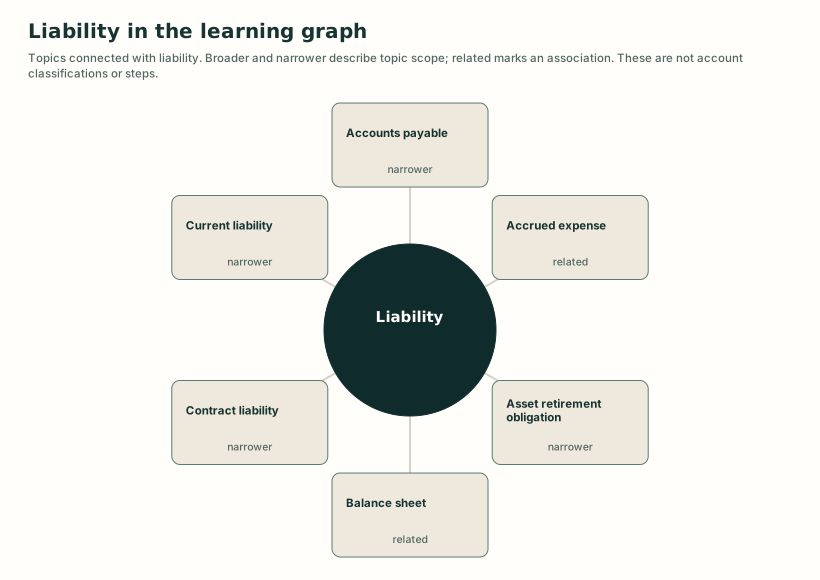
A topic map showing selected connections with liability.
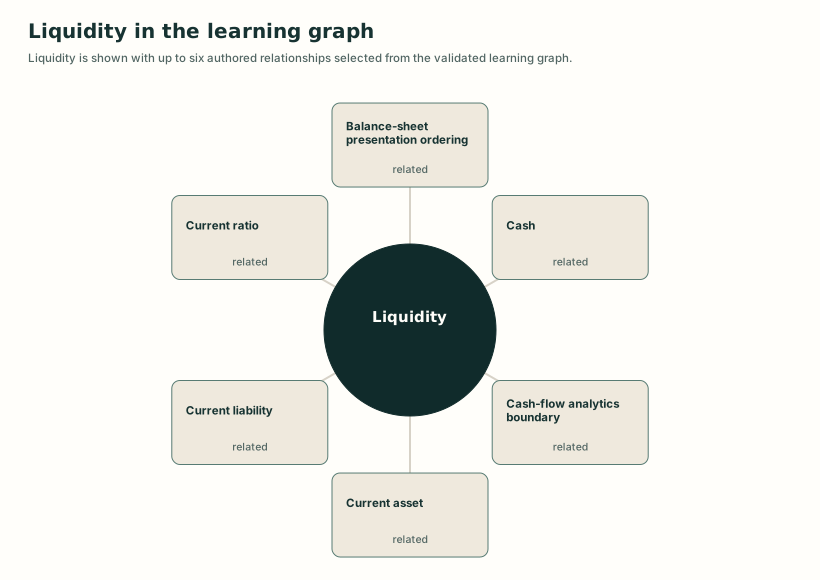
A graph bound structural map connecting Liquidity to authored conceptual, prerequisite, and teaching relationships.
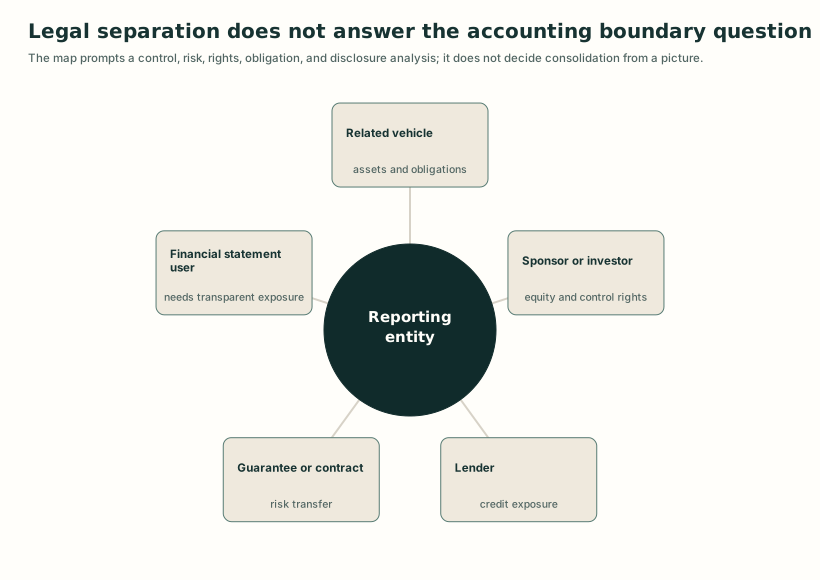
A structural map of a reporting entity, related vehicle, investor, lender, and contract around an off balance sheet financing question.
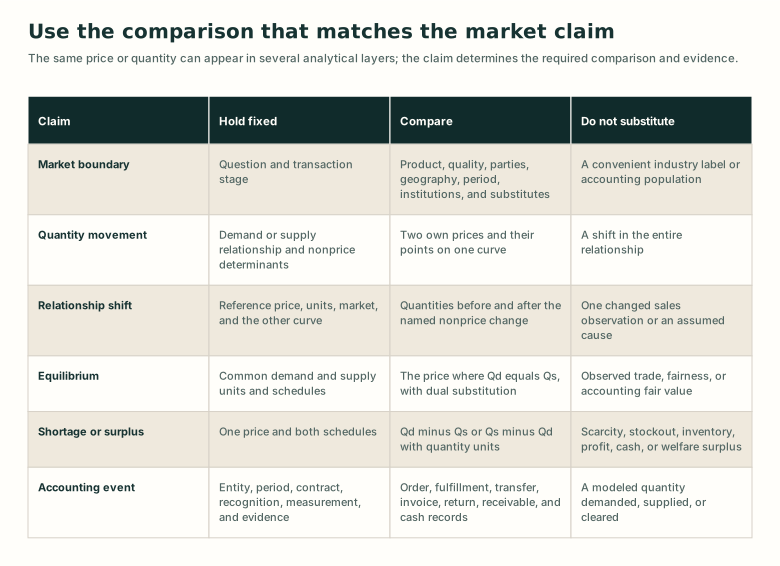
A deterministic table distinguishing market boundary, own price movement, relationship shift, equilibrium, imbalance, and accounting event claims.
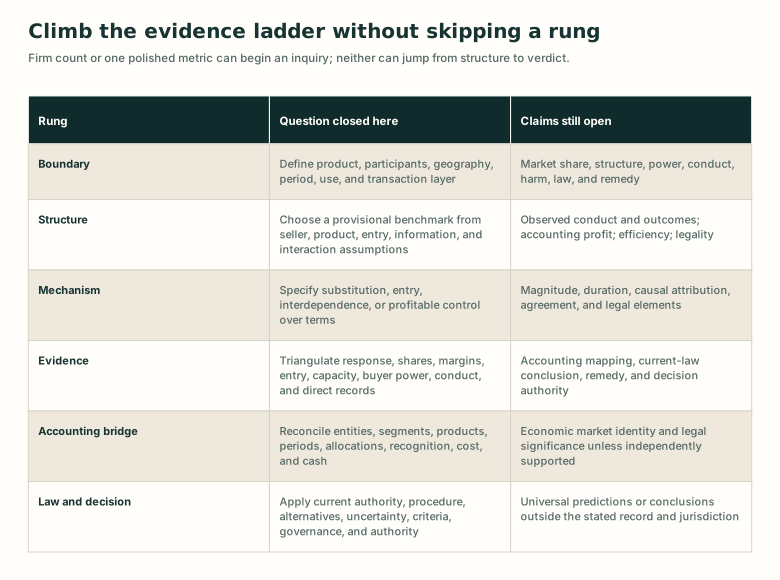
A deterministic evidence ladder from boundary and model classification through mechanism, empirical evidence, accounting bridge, legal analysis, and decision authority.
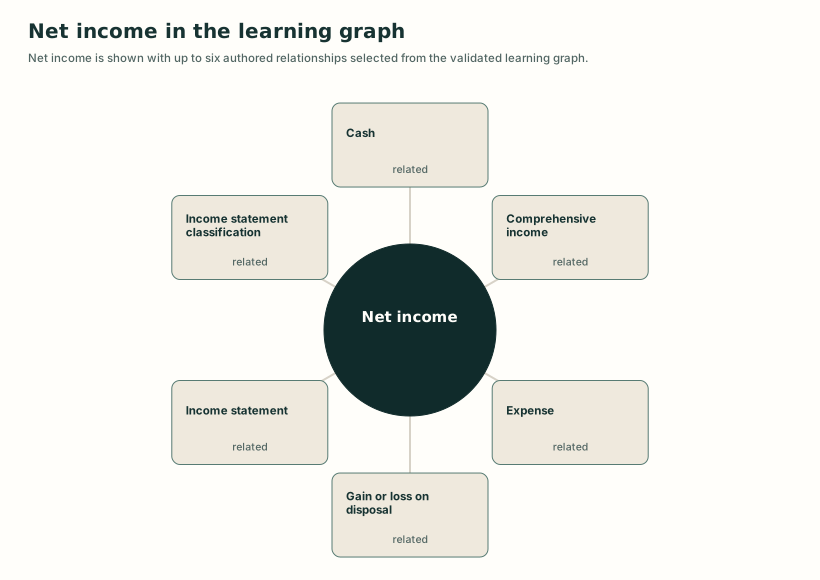
A graph bound structural map connecting Net income to authored conceptual, prerequisite, and teaching relationships.
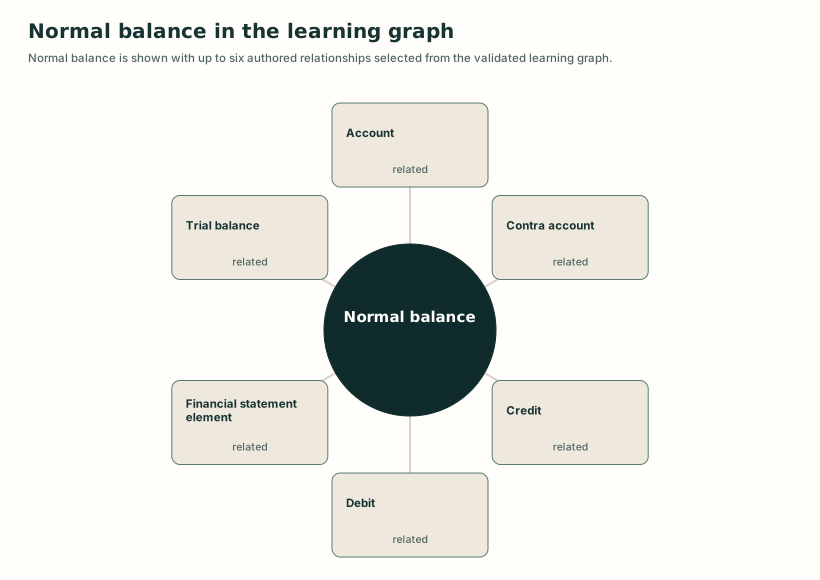
A graph bound structural map connecting Normal balance to authored conceptual, prerequisite, and teaching relationships.
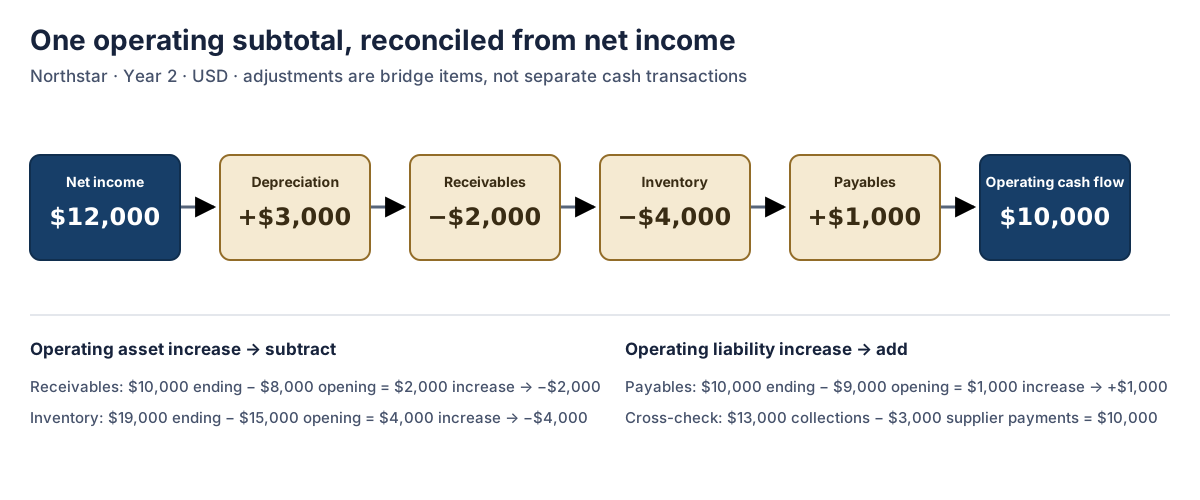
An accessible left to right bridge from $12,000 net income through four signed adjustments to $10,000 operating cash flow.
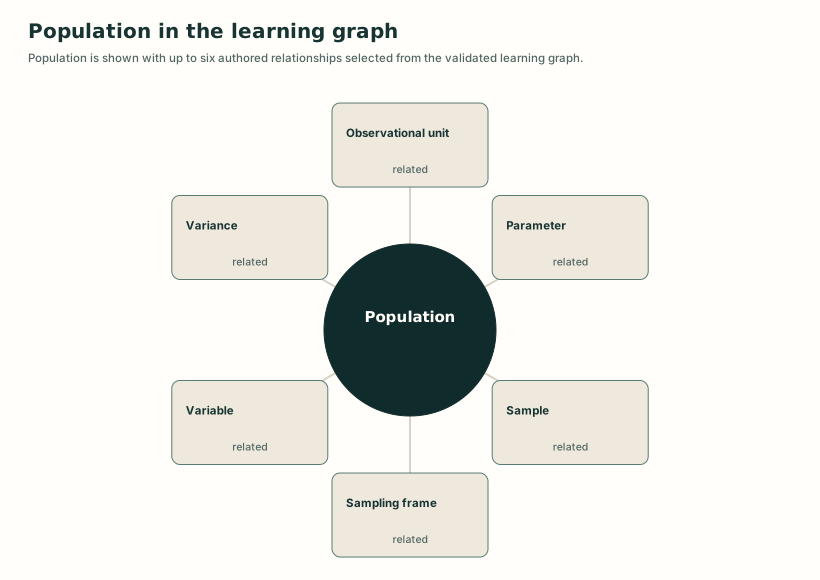
A graph bound structural map connecting Population to authored conceptual, prerequisite, and teaching relationships.
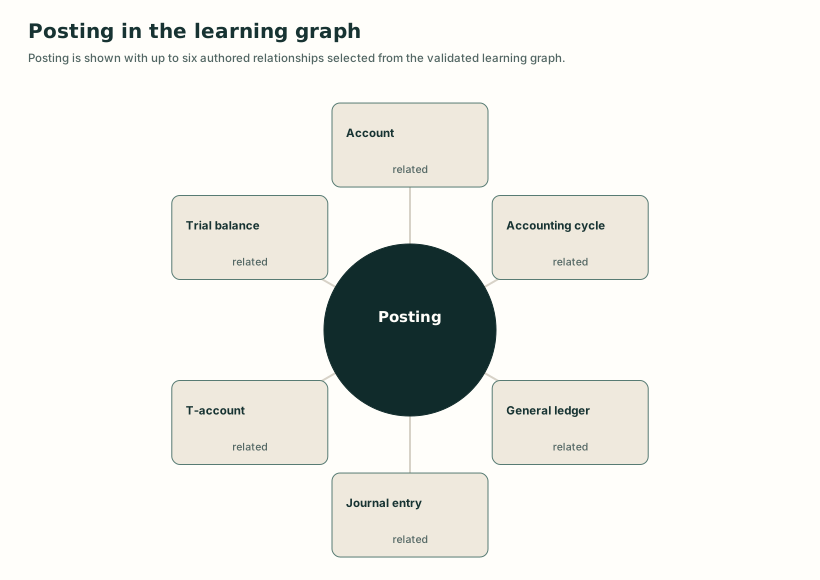
A graph bound structural map connecting Posting to authored conceptual, prerequisite, and teaching relationships.
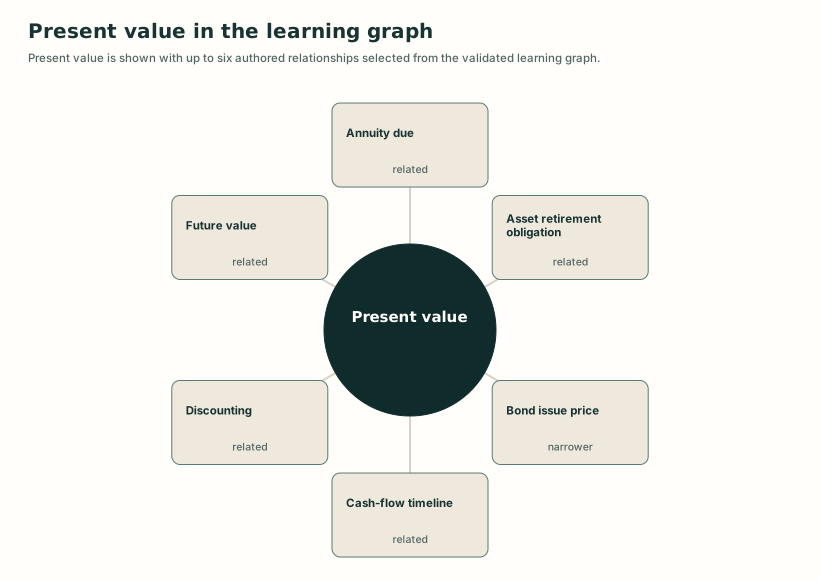
A graph bound structural map connecting Present value to authored conceptual, prerequisite, and teaching relationships.
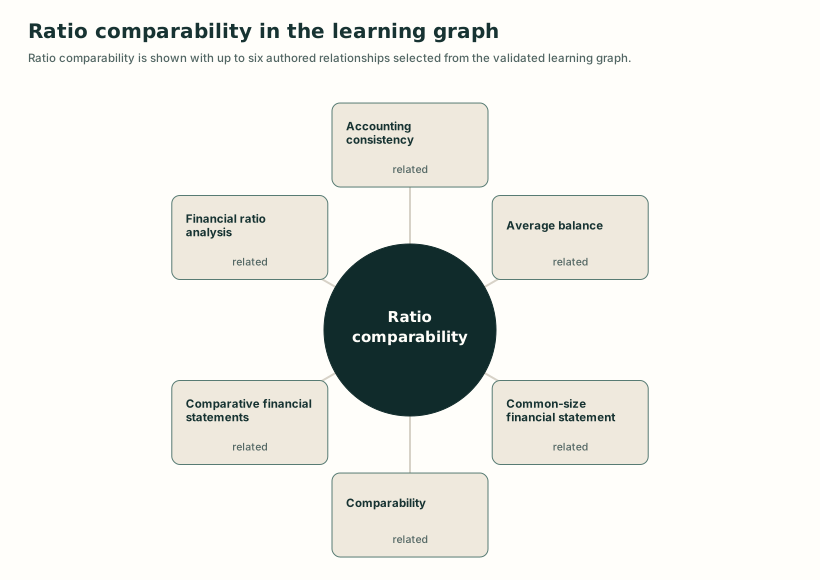
A graph bound structural map connecting Ratio comparability to authored conceptual, prerequisite, and teaching relationships.
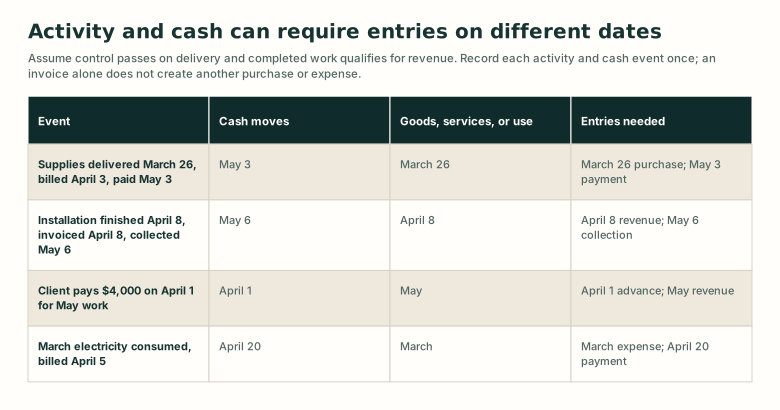
A comparison of four transactions in which cash, performance, and the document fall on different dates.
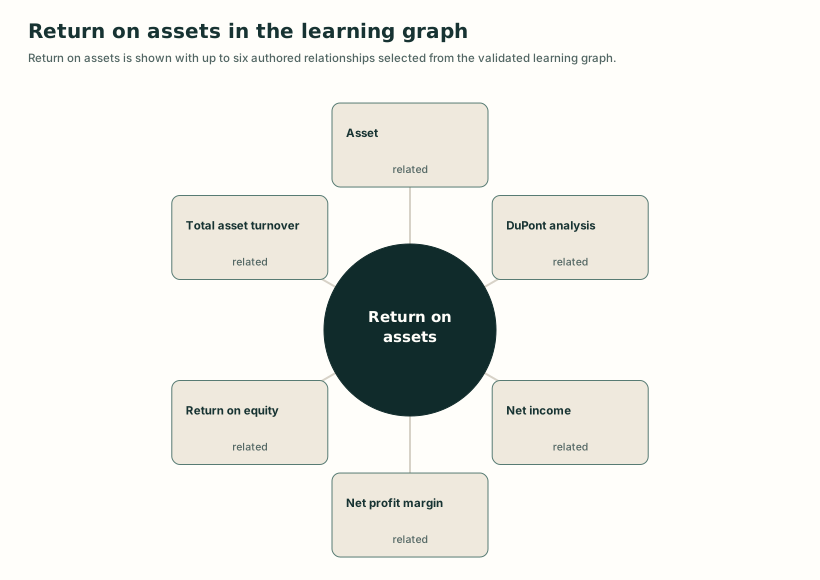
A graph bound structural map connecting Return on assets to authored conceptual, prerequisite, and teaching relationships.
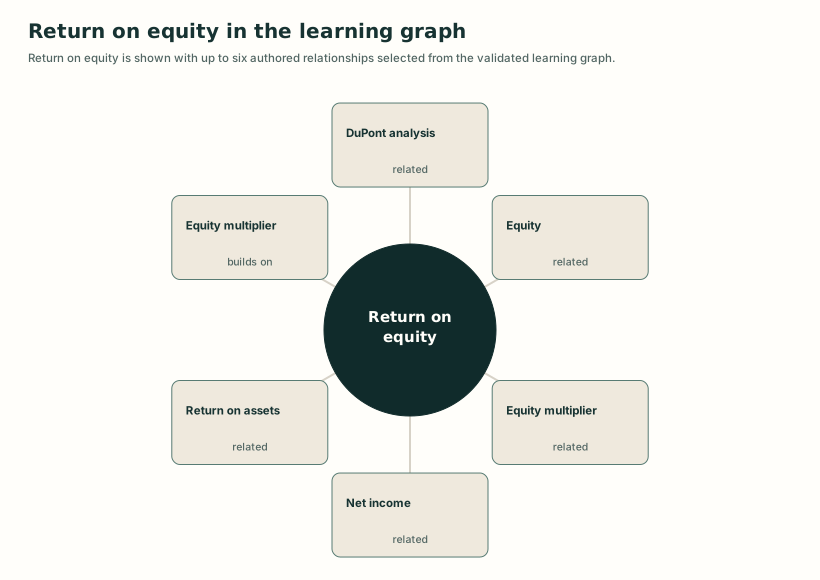
A graph bound structural map connecting Return on equity to authored conceptual, prerequisite, and teaching relationships.
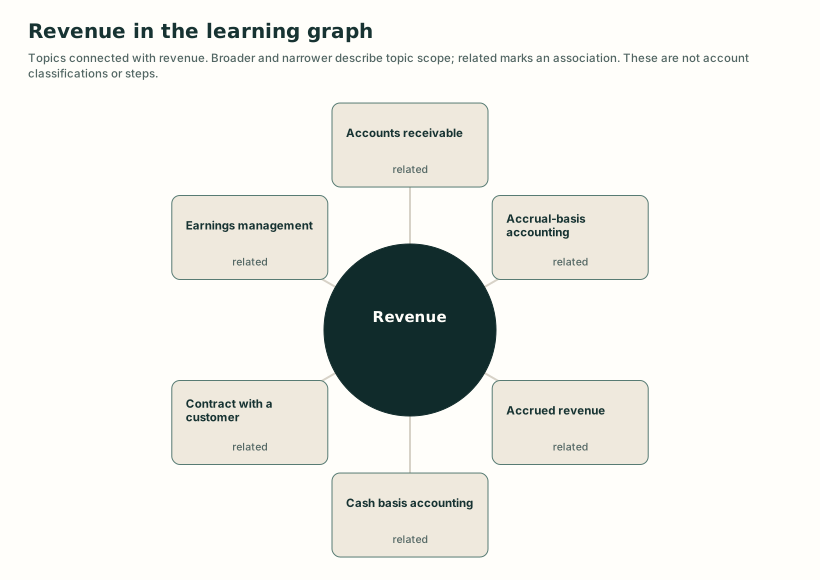
A topic map showing selected connections with revenue.
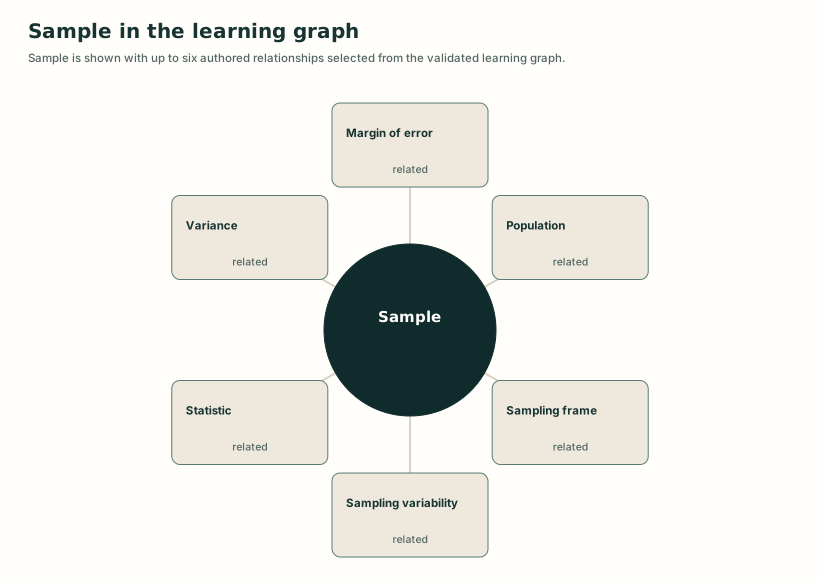
A graph bound structural map connecting Sample to authored conceptual, prerequisite, and teaching relationships.
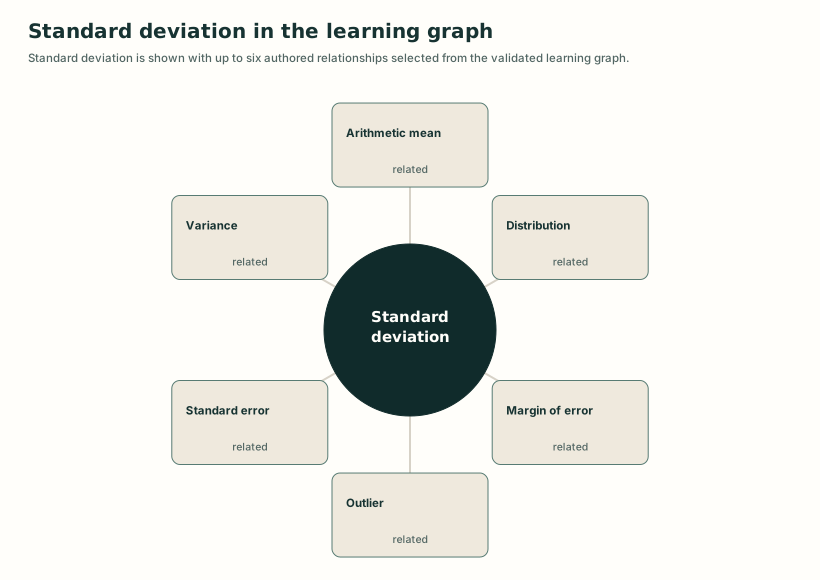
A graph bound structural map connecting Standard deviation to authored conceptual, prerequisite, and teaching relationships.
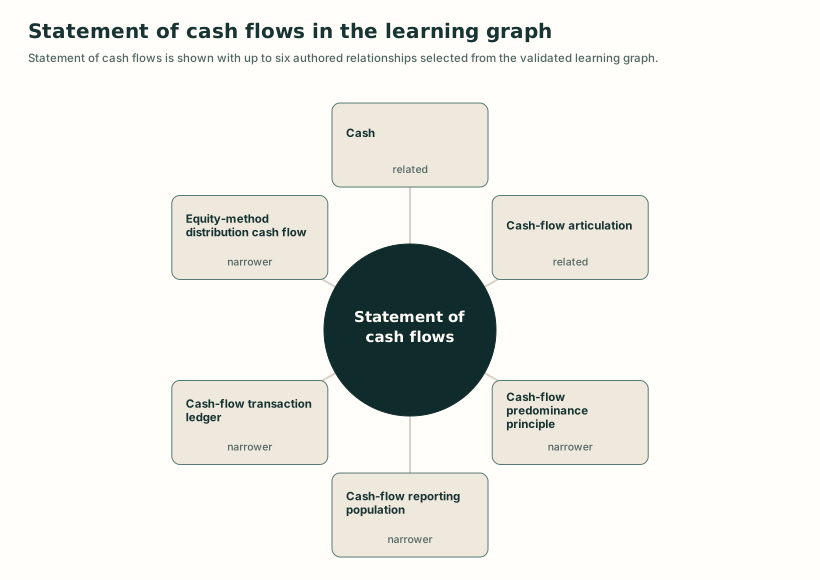
A graph bound structural map connecting Statement of cash flows to authored conceptual, prerequisite, and teaching relationships.
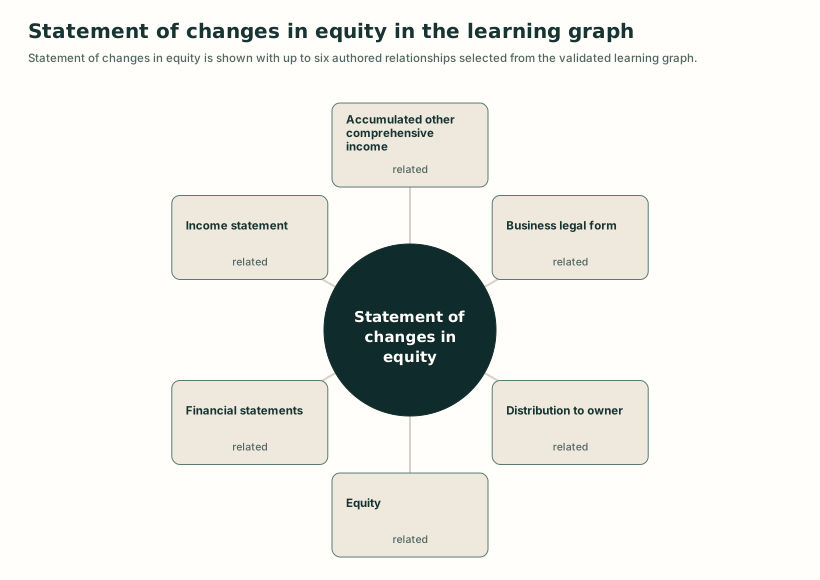
A graph bound structural map connecting Statement of changes in equity to authored conceptual, prerequisite, and teaching relationships.
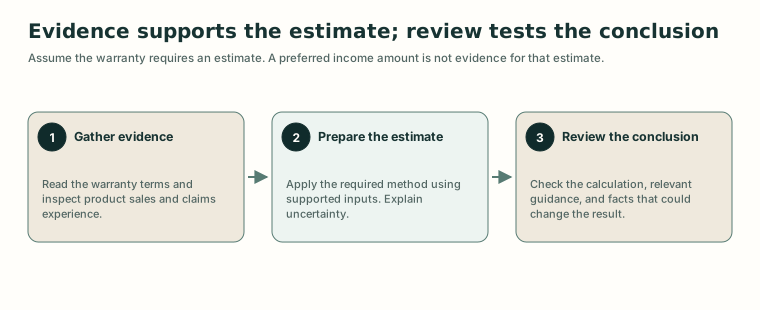
Connect contract and claims evidence to an estimate and a documented review.
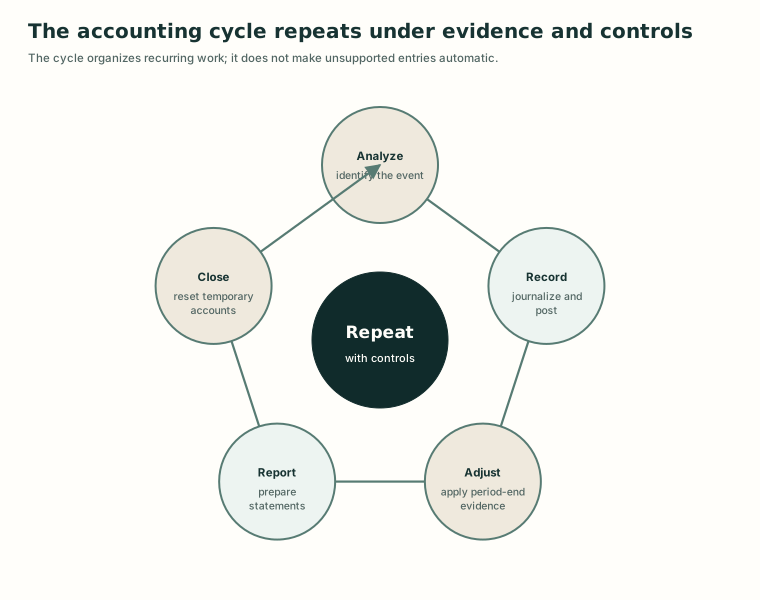
A cyclic view from evidence through recording, adjustment, reporting, and closing.
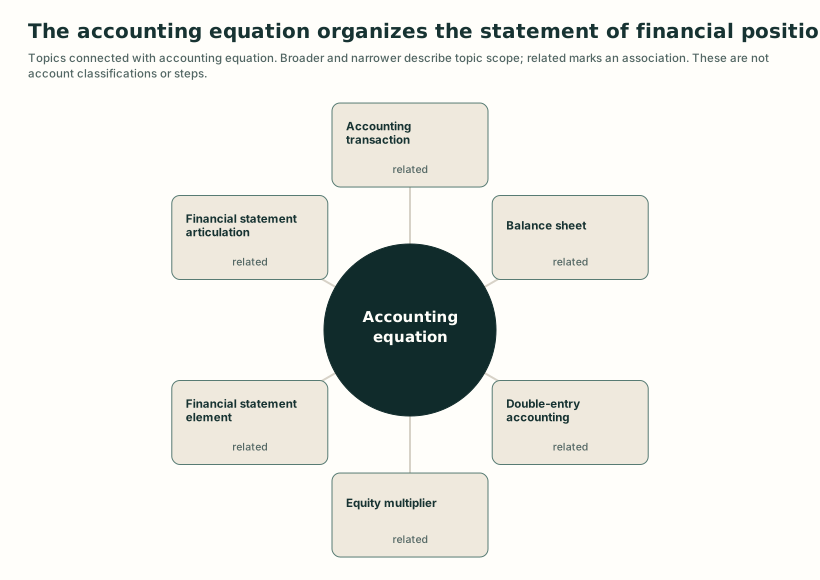
A topic map showing selected connections with accounting equation.
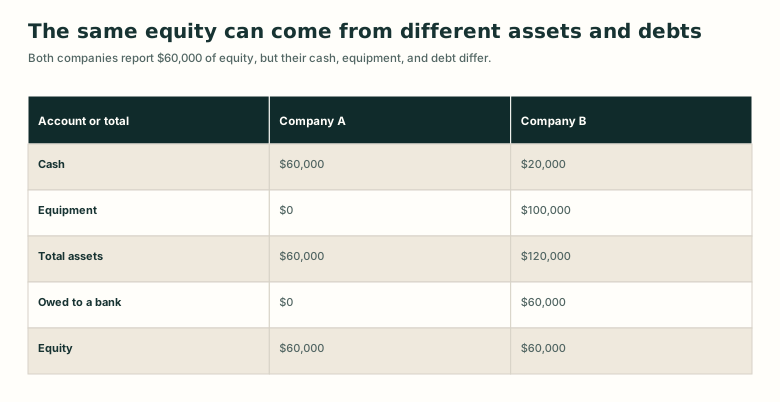
A comparison of two companies with the same equity but different cash, equipment, and debt.
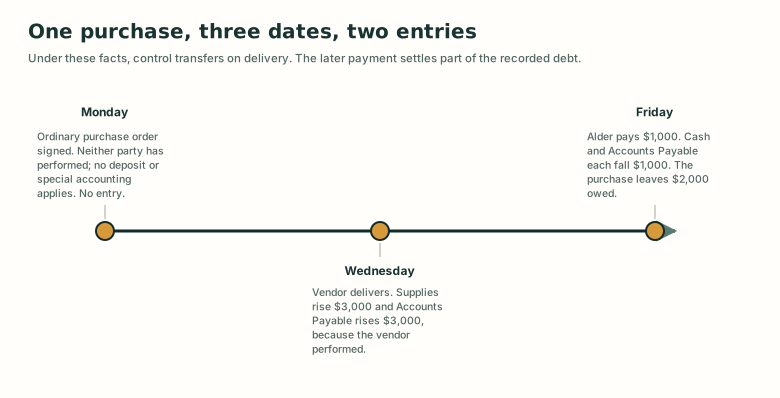
A timeline separating the signing of a purchase order from the delivery and the partial payment that follow it.
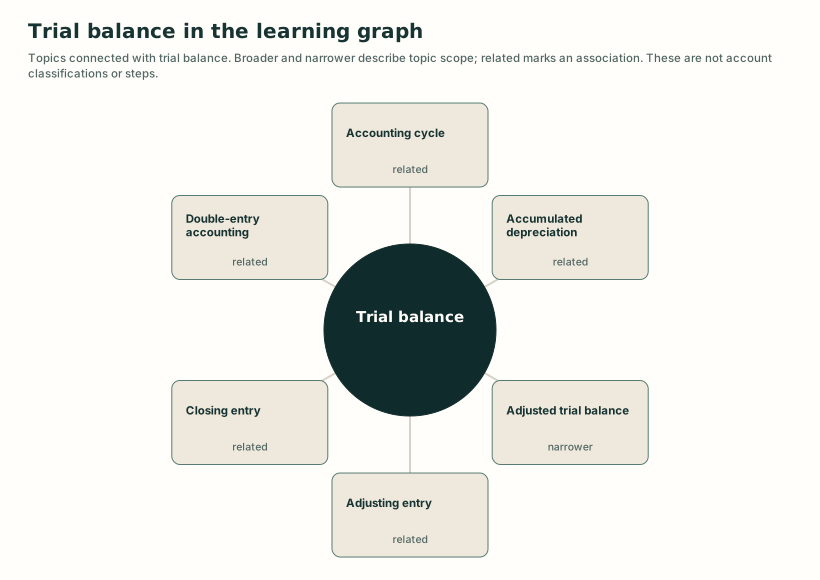
A topic map showing selected connections with trial balance.
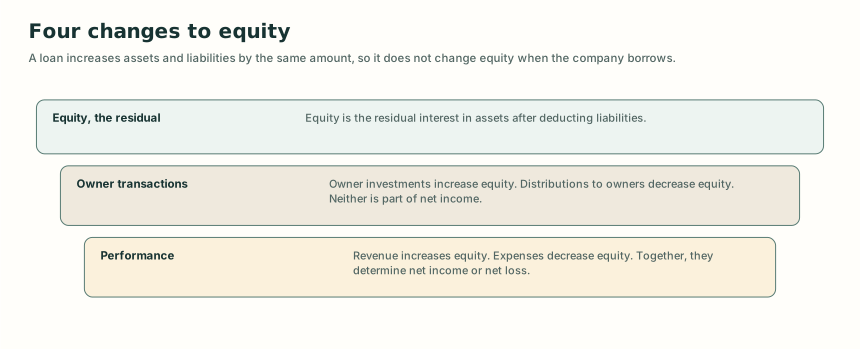
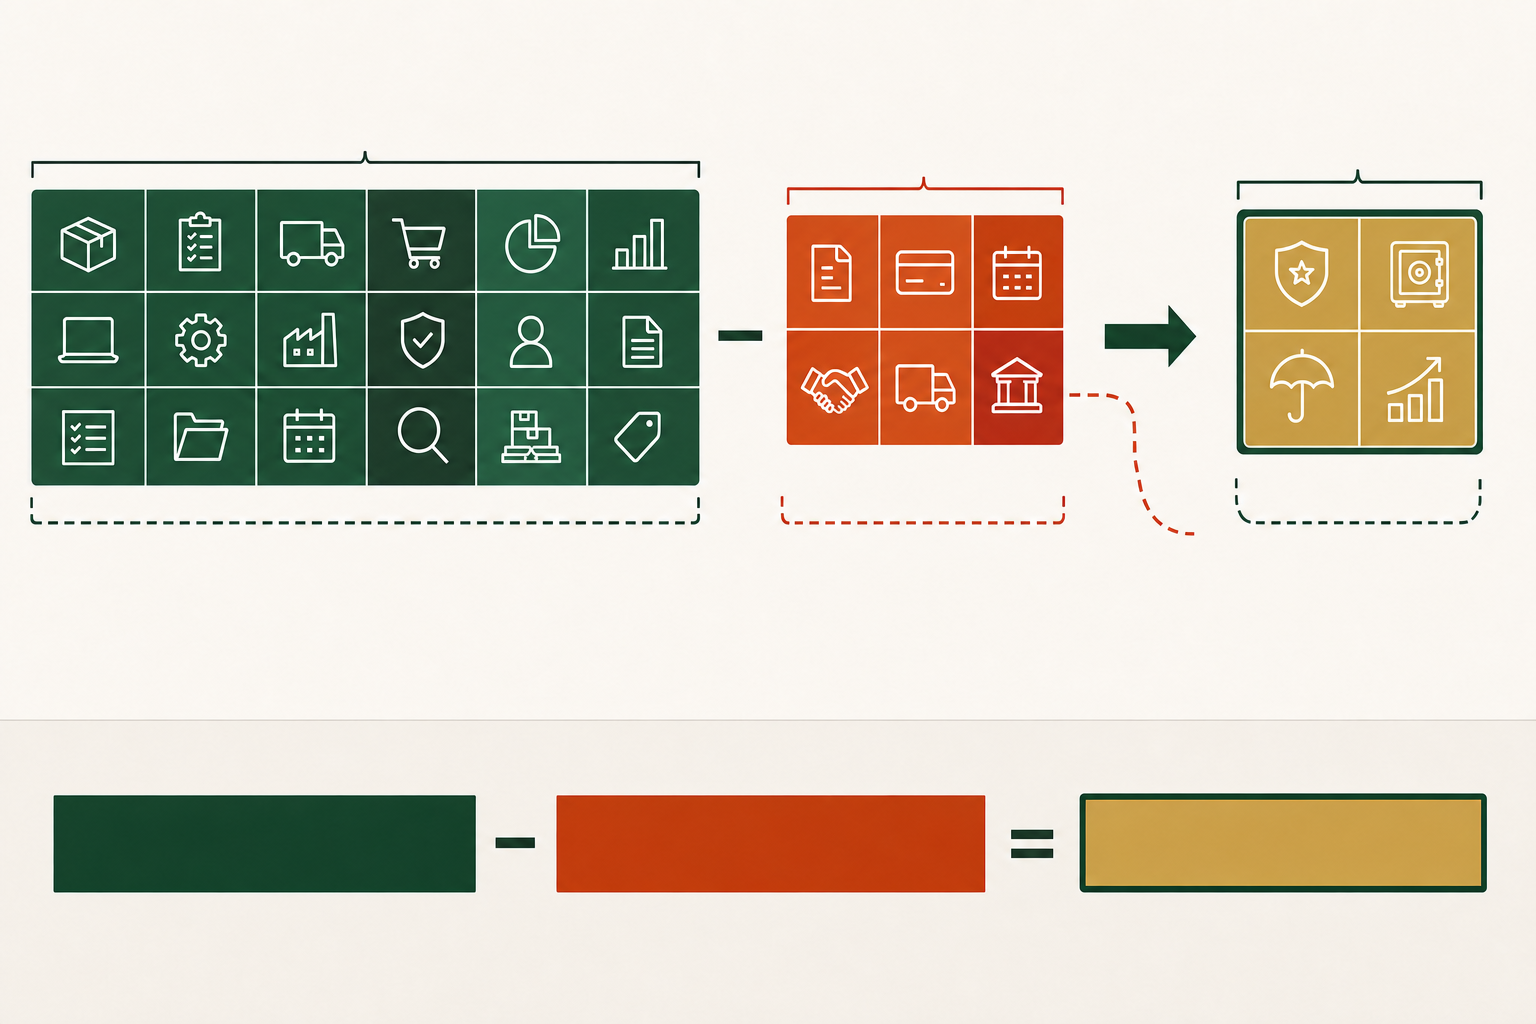
Owner transactions and business performance change equity; borrowing does not.
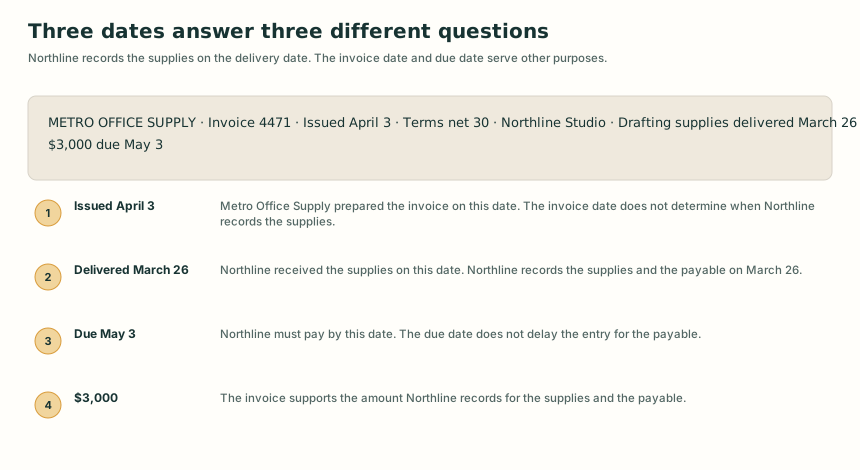
An annotated vendor invoice that distinguishes the delivery, invoice, and payment dates.
An equation bridge separating working capital from the related current ratio.