Detailed visual description
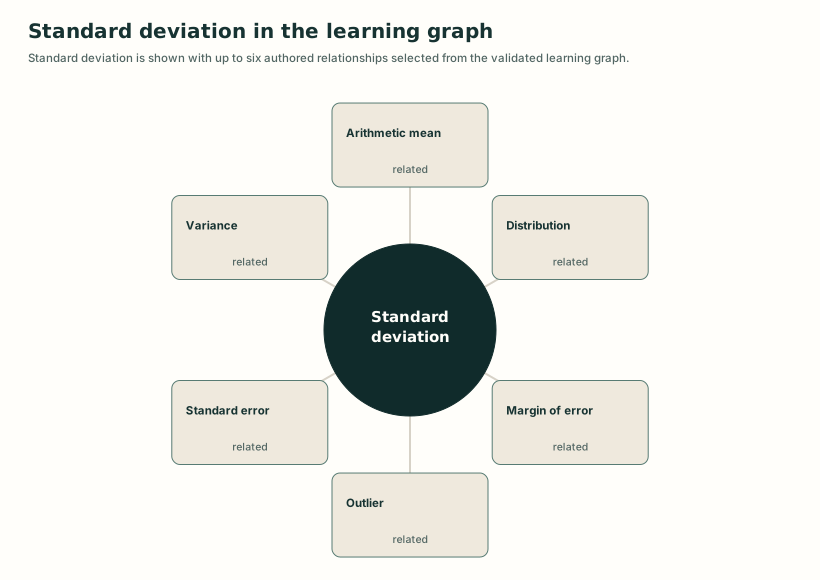
A structural map places Standard deviation at the center and connects it to related concepts, prerequisite concepts, or lessons from the knowledge graph. Edge labels distinguish broader, narrower, related, prerequisite, and teaching relationships where present.
Review apparatus
Visual provenance and review
- Technique
- structural svg
- Role
- structural
- Review state
- candidate
- Rights
- CC0-1.0 · Project-authored graph-bound teaching diagram
Review notes
- Graph-bound preview generated from authored relations; inspect neighbor choice, label wrapping, and print legibility before acceptance.