A timeline is the control surface for financial mathematics. Mark t = 0 as
the declared valuation date, not automatically “today.” Mark later boundaries
at equal intervals and place each cash flow on its actual boundary. A single
sum at t = 3 is not three annual payments, and a payment at the beginning of
each year is not an end-of-year stream.
For a three-year target, a minimal timeline reads:
t=0             t=1             t=2             t=3
valuation date                                      $60,000 target
The three gaps—not the four labels—supply n = 3. If the rate is monthly, the
same horizon must be rewritten as 36 monthly intervals before it can be used.
Signs and viewpoints
Signs describe a declared viewpoint. A borrower may show loan proceeds as a positive inflow and repayments as negative outflows. A lender sees the reverse. The value of the stream can be reconciled under either convention if the viewpoint is consistent. An unlabeled negative number is not self-explanatory.
Accounting and finance uses
An accounting learner uses the timeline to preserve measurement date and cash- flow timing before consulting the applicable guidance. A finance learner uses it to separate an investment, distribution, borrowing, or repayment from the date at which value is compared. Neither use makes the selected cash flows or rate appropriate merely because the diagram is tidy.
Stop when dates are missing, intervals are unequal but the method assumes equal periods, payment timing is ambiguous, or annual and subannual units do not match. Fix the fact pattern before calculating.
Cash-flow timeline in the learning graph
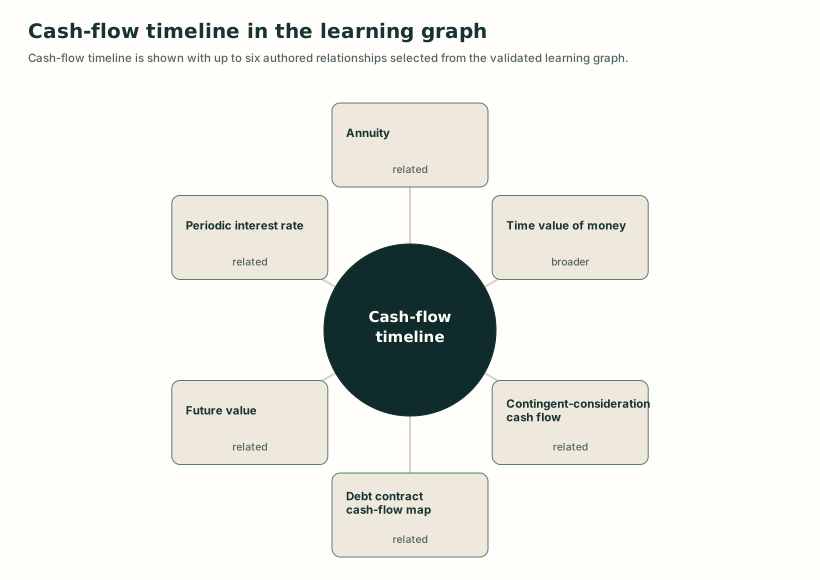
Detailed visual description
A structural map places Cash-flow timeline at the center and connects it to related concepts, prerequisite concepts, or lessons from the knowledge graph. Edge labels distinguish broader, narrower, related, prerequisite, and teaching relationships where present.
Put the concept to work
Understand this concept
- Explain how dates, interval boundaries, cash-flow direction, and the valuation point control a time-value problem before any formula is selected.
Apply this concept
- Build and audit a cash-flow timeline from a bounded fact pattern, including the valuation date, every payment date, equal-length periods, and declared signs.
Learning resources
Choose a lesson, try an application, or inspect the sources behind this concept.
Build on these ideas
- Cash-flow timeline — Understand
To apply this concept: Required. A usable diagram must preserve the meaning of dates and interval boundaries.
Lessons
Worked examples and cases
Practice
Common mistaken ideas
Sources
Broader topics
Related concepts
Show 3 more related concepts
Use this idea next
- Annuity — Apply
Required level here: apply. Required. Classification depends on dates and boundary placement.
- Annuity — Understand
Required level here: understand. Required. An annuity is defined by the placement of payments on equal boundaries.
- Cash-flow timeline — Apply
Required level here: understand. Required. A usable diagram must preserve the meaning of dates and interval boundaries.
Show 5 more next steps
- Contingent-consideration cash flow — Understand
Required level here: apply. Required. Classification depends on acquisition and settlement dates.
- Future value — Apply
Required level here: apply. Required. The later date and number of intervals must be derived before calculation.
- Periodic interest rate — Understand
Required level here: understand. Required. The timeline defines the interval to which the periodic rate must apply.
- Present value — Apply
Required level here: apply. Required. The valuation date and number of intervals must be explicit.
- Time value of money — Understand
Required level here: understand. Required. Different dates and the selected comparison date must be visible.