A distribution keeps the individual values in view. A mean compresses them; the distribution shows what that compression hides.
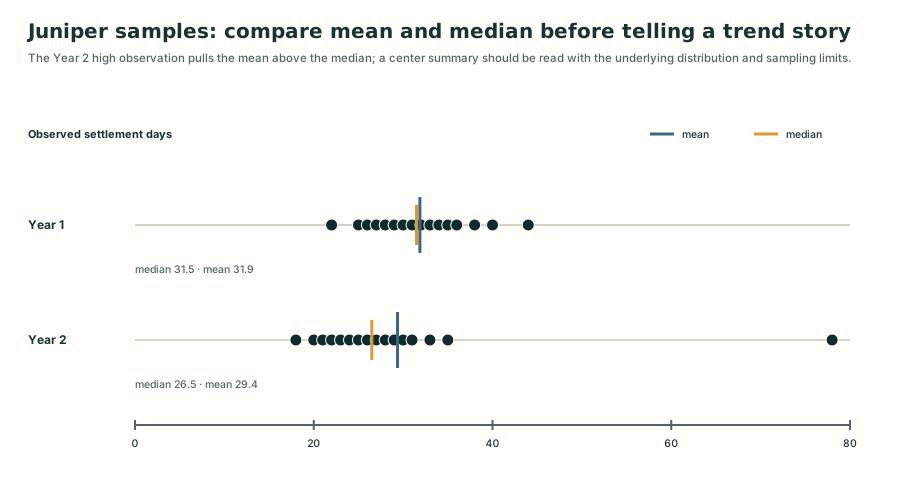
Juniper's Year 2 settlement sample has most observations between 18 and 35 days and one at 78. Its mean is 29.375 days, while its median is 26.5. Reporting only the mean conceals both the dense lower cluster and the long upper tail.
A practical description
Ask six questions:
- Where is the center?
- How far apart are typical values?
- Are the tails balanced or skewed?
- Are there gaps or multiple clusters?
- Which observations are unusual under a declared rule?
- Does time order or grouping reveal structure that an unordered list hides?
Ordered values, a frequency table, histogram, box plot, or time plot can answer different parts of that list. No one display proves a probability model.
Comparing distributions in business work
Two periods can have the same mean but different volatility or tails. Two portfolios can share a standard deviation while differing in downside shape. Two invoice samples can have similar centers but different concentrations of late settlements. Align definitions, units, periods, and selection designs before attributing a difference to the business rather than to the data.
The foundational module describes empirical samples. It does not assert a normal distribution or convert a sample pattern into a forecast.
Juniper invoice-settlement samples: center can hide shape
Detailed visual description
The chart reads the sixteen settlement-day observations in each checked fictional sample and plots every observation on a common zero-to-eighty-day axis. Year 1 values occupy a compact range from 22 to 44 days, with median 31.5 and mean 31.9. Year 2 values mostly range from 18 to 35 days but include a separated 78-day observation; its median is 26.5 and mean is 29.4. The display does not establish a population trend or causal explanation.
Put the concept to work
Understand this concept
- Describe a univariate distribution through its location, spread, shape, gaps, clusters, and unusual values rather than through one summary alone.
Analyze this concept
- Compare two business-data distributions using aligned units, visible ordered values or plots, multiple summaries, and explicit tail and comparability qualifications.
Learning resources
Choose a lesson, try an application, or inspect the sources behind this concept.
Build on these ideas
- Distribution — Understand
To analyze this concept: Required. Comparison requires attention to each component of the distribution.
- Measurement scale — Understand
To understand this concept: Helpful. The scale limits which order and distance descriptions are meaningful.
- Variable — Understand
To understand this concept: Required. A distribution describes the observed or possible values of one defined variable.
Lessons
Worked examples and cases
- Compare Juniper's two settlement-time distributions
- Decide what Juniper's invoice samples actually support
- Investigate Juniper's 78-day invoice
Show 1 more examples and cases
Practice
Common mistaken ideas
Sources
Related concepts
Show 5 more related concepts
Use this idea next
- Arithmetic mean — Understand
Required level here: understand. Required. The mean is one summary of a complete value pattern.
- Distribution — Analyze
Required level here: understand. Required. Comparison requires attention to each component of the distribution.
- Median — Understand
Required level here: understand. Required. The median is a positional summary of an ordered distribution.
Show 2 more next steps
- Outlier — Understand
Required level here: understand. Required. Unusualness is judged relative to a distribution and declared method.
- Standard deviation — Analyze
Required level here: analyze. Required. A standard deviation cannot reveal shape or tail structure by itself.