Standard deviation translates variance back into the variable's units. A sample standard deviation of 6 days describes invoice-to-invoice spread in days, not squared days.
What it does—and does not—say
Standard deviation uses every observation and gives greater influence to
values farther from the mean. Juniper's 78-day invoice therefore increases
Year 2's sample standard deviation sharply. The result accurately describes
the supplied sample under the declared n - 1 convention. It does not decide
whether 78 is erroneous or predict how often future invoices will be late.
Statements such as “most observations fall within two standard deviations” need a distributional basis. That familiar rule fits an approximately normal model; it is not guaranteed for an arbitrary business distribution.
Do not confuse two kinds of spread
Standard deviation describes variation among observations. The standard error of the mean describes estimated variation among sample means under repeated sampling. They have related formulas but different objects. More observations can reduce standard error while the underlying invoice-level standard deviation remains similar.
When comparing groups or periods, align variable definitions, units, selection designs, and denominator conventions. A larger standard deviation is a descriptive difference, not automatically greater financial risk or worse operating control.
Standard deviation in the learning graph
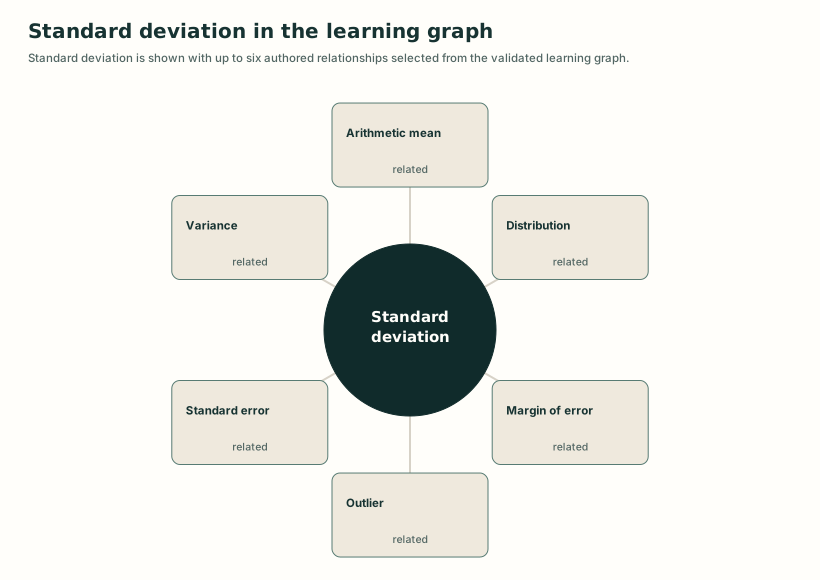
Detailed visual description
A structural map places Standard deviation at the center and connects it to related concepts, prerequisite concepts, or lessons from the knowledge graph. Edge labels distinguish broader, narrower, related, prerequisite, and teaching relationships where present.
Put the concept to work
Understand this concept
- Explain standard deviation as the square root of a declared variance and distinguish spread of observations from uncertainty in an estimate.
Analyze this concept
- Compare sample or population standard deviations in original units while qualifying extreme values, shape, scale, and comparability.
Learning resources
Choose a lesson, try an application, or inspect the sources behind this concept.
Build on these ideas
- Distribution — Analyze
To analyze this concept: Required. A standard deviation cannot reveal shape or tail structure by itself.
- Standard deviation — Understand
To analyze this concept: Required. Interpretation requires the distinction between observation spread and estimate precision.
- Variance — Understand
To understand this concept: Required. Standard deviation inherits the variance definition and denominator.
Lessons
Worked examples and cases
Practice
Common mistaken ideas
Sources
Related concepts
Show 3 more related concepts
Use this idea next
- Standard deviation — Analyze
Required level here: understand. Required. Interpretation requires the distinction between observation spread and estimate precision.
- Standard error — Understand
Required level here: understand. Required. The foundational mean standard error uses sample observation spread as an input.