Income elasticity of demand changes the driver from own price to income. A positive signed result describes a normal-good relationship in the specified market and range; a negative result describes an inferior-good relationship. These labels describe response direction, not quality, dignity, necessity, or social value.
Income is the changing input in this calculation. Own-price demand elasticity changes the focal good's price. Cross-price elasticity changes another good's price. This income-response model holds those prices and other stated demand determinants fixed.
Suppose a defined household group's inflation-consistent income measure rises from $50,000 to $55,000. Annual demand for a service rises from 100 to 108 units. Its own price and other modeled determinants stay fixed:
quantity midpoint change = 8 / 104 = 7.6923%
income midpoint change   = 5,000 / 52,500 = 9.5238%
income elasticity        = 0.8077
The positive sign supports a normal-good classification for that population, period, definition, and range. It does not establish a universal product type.
Define income before calculating
Household, personal, disposable, nominal, real, permanent, and current income are not interchangeable. Population composition and price-level treatment can change the estimate. If both income and prices rise, a nominal-income change does not by itself identify greater purchasing power.
Income may be correlated with age, location, household composition, employment, credit access, tastes, and other variables. An observational coefficient does not isolate a causal income effect unless the design supports that claim.
Planning use is conditional
The estimate can inform scenarios, but it does not forecast units without an income path, own and related prices, market definition, competing changes, and uncertainty. It also does not establish seller revenue, profit, recognition, or cash. Translate demand into operational and accounting outcomes only after the transaction and cost layers are supplied.
An elasticity coefficient needs an interpretation ledger
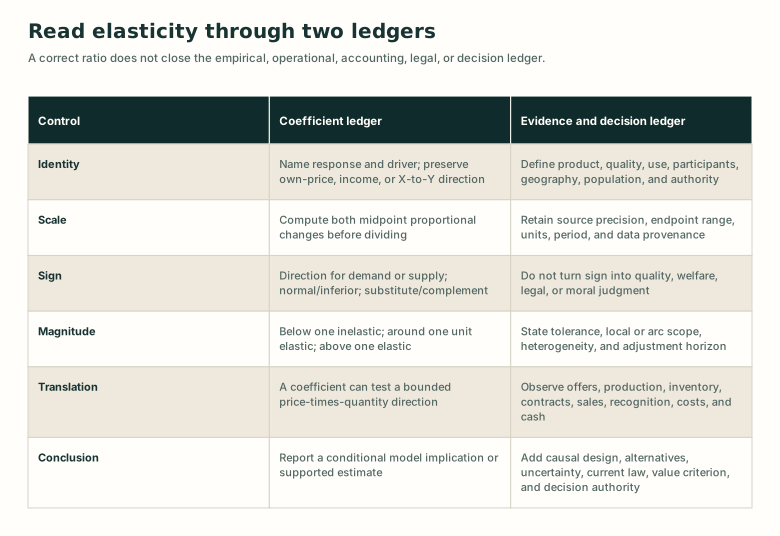
Detailed visual description
The coefficient ledger names response and driver, computes both midpoint percentage changes, preserves sign, classifies absolute magnitude, and reports a conditional result. The evidence ledger defines market scope, data provenance, adjustment horizon, causal posture, operational records, accounting events, legal authority, alternatives, uncertainty, value criteria, and decision authority.
Put the concept to work
Analyze this concept
- Compute midpoint income elasticity, use its sign to classify the observed relationship, and qualify the income measure, population, range, period, held-constant conditions, and planning limits.
Learning resources
Choose a lesson, try an application, or inspect the sources behind this concept.
Build on these ideas
- Demand — Analyze
To analyze this concept: Required. Income is a nonprice demand determinant, so its change describes a relationship shift rather than movement caused by own price.
- Elasticity — Analyze
To analyze this concept: Required. Income response uses the same proportional-change control but a different driver interpretation.