On this page
Elasticity compares proportional changes. It asks how large the response is relative to its own scale and how large the driver change is relative to its scale. That makes the result unit-free and permits comparisons that a raw slope often obscures.
Suppose a response falls from 900 to 700 while its driver rises from 50 to 70. The midpoint changes are:
response change = -200 / 800 = -25.00%
driver change   =   20 /  60 =  33.33%
elasticity      = -25.00% / 33.33% = -0.75
The sign records direction. The magnitude, 0.75, records responsiveness. A magnitude below one is inelastic over this arc; one is unit elastic; above one is elastic. “Inelastic” does not mean unchanged, unimportant, irrational, or immune to every influence.
Use the midpoint base in both directions
Using the starting value as a percentage base gives a different answer when the endpoints are reversed. The midpoint method uses the average of the two endpoint values for each percentage change. Traveling from A to B or B to A then changes signs but not the elasticity magnitude.
The method does not make the relationship constant. A curve can have different elasticities at different points, and an estimate over a large arc can hide meaningful local variation. Report both endpoints and avoid treating one coefficient as a permanent property.
Preserve the complete variable contract
Name the response and driver. State product or service, quality, participants, geography, period, price basis, quantity basis, and what else is held constant. Four common measures share a calculation pattern but answer different questions:
- price elasticity of demand responds with quantity demanded and changes the same good's price;
- price elasticity of supply responds with quantity supplied and changes the same good's price;
- income elasticity of demand responds with quantity demanded and changes a stated income measure; and
- cross-price elasticity of demand responds with one good's quantity demanded and changes another good's price.
Their signs do not carry the same interpretation. OpenStax Section 5.1 compares own-price demand and supply measures. Section 5.4 covers income and cross-price measures.
An elasticity computed from a stipulated curve is a model implication. An elasticity estimated from observations inherits sampling, measurement, specification, and identification limits. Neither becomes causal merely because the arithmetic is precise.
Keep accounting and decision claims separate
Elasticity can inform pricing, capacity, budgeting, risk, and policy analysis. It does not determine revenue recognition, transaction price, inventory, profit, cash, or a recommended action. Those conclusions require entity-level events, contracts, costs, constraints, uncertainty, alternatives, and authority.
An elasticity coefficient needs an interpretation ledger
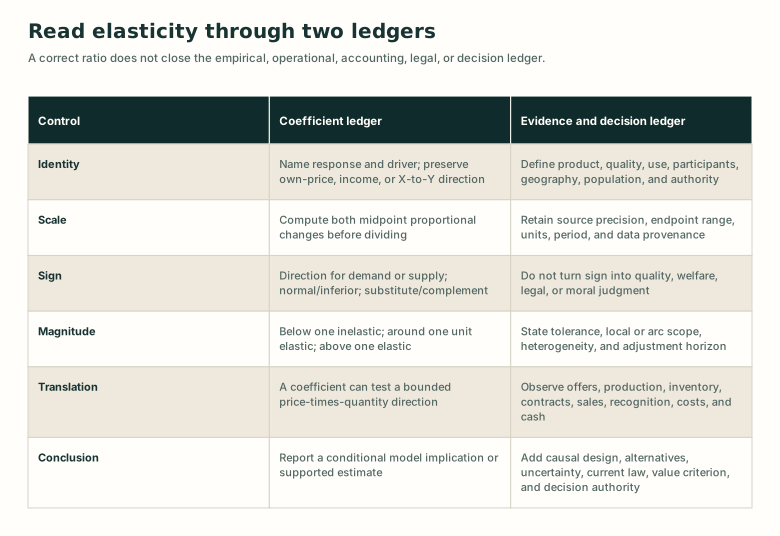
Detailed visual description
The coefficient ledger names response and driver, computes both midpoint percentage changes, preserves sign, classifies absolute magnitude, and reports a conditional result. The evidence ledger defines market scope, data provenance, adjustment horizon, causal posture, operational records, accounting events, legal authority, alternatives, uncertainty, value criteria, and decision authority.
Put the concept to work
Analyze this concept
- Compute a midpoint elasticity, separate sign from magnitude, classify responsiveness around one, and state the market, range, period, units, assumptions, and non-claims that bound the result.
Learning resources
Choose a lesson, try an application, or inspect the sources behind this concept.
Build on these ideas
- Economic model — Analyze
To analyze this concept: Required. An elasticity inherits the specification and domain of the relationship from which its changes are drawn.
- Quantity demanded — Apply
To analyze this concept: Helpful. Own-price and cross-price examples require a correctly scoped response quantity.
Lessons
Worked examples and cases
- Classify a bounded Cedar income response
- Classify two Harbor related-good responses
- Compare Linden demand and supply responsiveness
Show 1 more examples and cases
Practice
Common mistaken ideas
Sources
Broader topics
More specific topics
Show 1 more more specific topics
Related concepts
Show 1 more related concepts
Use this idea next
- Cross-price elasticity of demand — Analyze
Required level here: analyze. Required. The response and driver require the general midpoint and sign controls.
- Income elasticity of demand — Analyze
Required level here: analyze. Required. Income response uses the same proportional-change control but a different driver interpretation.
- Price elasticity of demand — Analyze
Required level here: analyze. Required. The midpoint calculation and sign-versus-magnitude distinction are inherited from the general elasticity concept.
Show 1 more next steps
- Price elasticity of supply — Analyze
Required level here: analyze. Required. Supply responsiveness uses the general midpoint and magnitude controls.