Price elasticity of demand asks how quantity demanded responds proportionally to the good's own price. Under the usual downward relationship, the signed coefficient is negative. Introductory work often reports its absolute magnitude so “0.75” means inelastic rather than “negative.” State which convention is in use.
Keep the response and driver fixed when selecting the measure. Price elasticity of supply responds with offered quantity. Income elasticity and cross-price elasticity keep quantity demanded as the response but change the driver.
For Linden chairs, compare two points on the same stipulated demand line:
| Own price | Quantity demanded per week |
|---|---|
| $50 | 900 |
| $70 | 700 |
The midpoint quantity change is -25%; the midpoint price change is 33.33%. Signed elasticity is -0.75 and conventional magnitude is 0.75. Quantity is responsive—it falls by 200 chairs—but proportionally less than price rises over this range.
Connect revenue only under a narrow scope
Price times quantity demanded is not automatically seller revenue. If every modeled unit is actually sold at the stated price, with no taxes, discounts, returns, rationing, quality change, or demand shift, the two endpoint products are:
$50 × 900 = $45,000
$70 × 700 = $49,000
Revenue moves with price over this inelastic arc. For an elastic arc, quantity's proportional movement dominates and the endpoint product moves oppositely; at unit elasticity it is unchanged locally under the same assumptions.
The endpoint-product test does not establish profit. Costs, capacity, competition, repeated adjustment, customer heterogeneity, taxes, contract terms, recognition, collections, and strategic responses remain outside the coefficient. A demand estimate also does not authorize a price change.
Determinants are hypotheses, not labels
Substitutes, budget share, time to adjust, market definition, and whether a purchase is readily deferred can affect measured responsiveness. These are reasons to investigate differences, not universal rankings. A narrow product definition can have a different elasticity from a broad category; short-run and long-run estimates can differ.
Always report endpoints, method, sign convention, market, period, source, and held-constant conditions. Without them, “demand is inelastic” is too incomplete to audit.
An elasticity coefficient needs an interpretation ledger
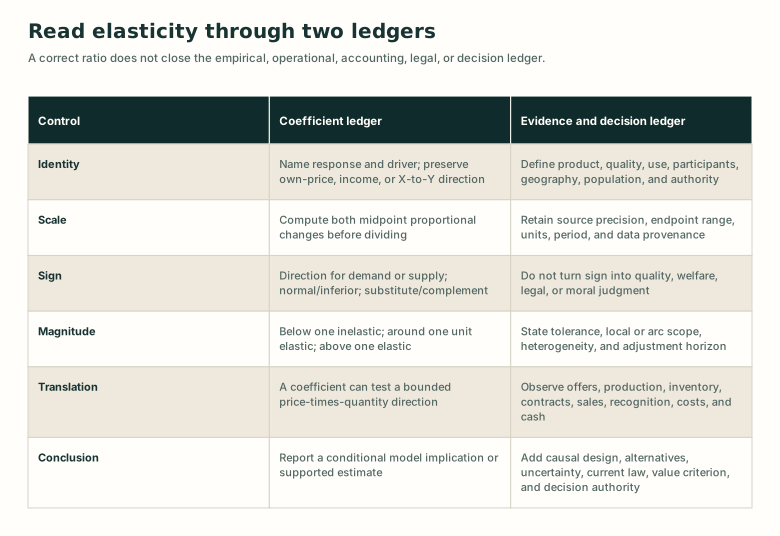
Detailed visual description
The coefficient ledger names response and driver, computes both midpoint percentage changes, preserves sign, classifies absolute magnitude, and reports a conditional result. The evidence ledger defines market scope, data provenance, adjustment horizon, causal posture, operational records, accounting events, legal authority, alternatives, uncertainty, value criteria, and decision authority.
Put the concept to work
Analyze this concept
- Compute midpoint own-price demand elasticity, interpret sign and magnitude, test the bounded total-revenue direction, and reject causal, profit, or pricing claims not supported by the scenario.
Learning resources
Choose a lesson, try an application, or inspect the sources behind this concept.
Build on these ideas
- Demand curve — Analyze
To analyze this concept: Required. The two endpoints must represent movements on the same demand relationship rather than an unrecognized shift.
- Elasticity — Analyze
To analyze this concept: Required. The midpoint calculation and sign-versus-magnitude distinction are inherited from the general elasticity concept.
Lessons
Worked examples and cases
Practice
Common mistaken ideas
Sources
Broader topics
Related concepts
Show 4 more related concepts
Use this idea next
- Market power — Analyze
Required level here: analyze. Helpful. Buyer response and substitution can constrain a firm's ability to change terms profitably.