Cross-price elasticity keeps two product identities visible. The numerator is the proportional change in quantity demanded of focal good X. The denominator is the proportional change in the price of related good Y. Reversing X and Y asks a different empirical question and need not return the same coefficient.
Another good's price is the driver in this calculation. Own-price demand elasticity instead changes the focal good's price. Income elasticity changes a defined income measure. Cross-price analysis holds the focal price and other stated demand determinants fixed.
A positive result supports a substitute relationship over the observed or modeled range: when Y becomes more expensive, demand for X rises. A negative result supports a complementary relationship: when Y becomes more expensive, demand for X falls. A near-zero estimate can reflect weak relatedness, an imprecise estimate, a poor market definition, offsetting segments, or an inadequate design; it does not prove that no relationship exists.
Compute before naming
Tea's price rises from $4 to $5 while coffee demand rises from 100 to 112. The midpoint changes are 22.2222% for tea price and 11.3208% for coffee quantity. Cross-price elasticity is about +0.5094. The sign supports a substitute relationship for coffee relative to tea under the stated facts.
If milk's price makes cereal demand fall, a negative coefficient can support a complementary relationship. The sign, not whether the magnitude exceeds one, does the classification work.
Relatedness is contextual
Products can be substitutes for one use and complements for another. Brand, quality, location, timing, switching cost, bundle terms, installed base, and customer segment can change the relationship. A historical estimate is not a permanent ontology label.
Competition and antitrust analysis require substantially more than one coefficient. Market definition, evidence design, supply response, entry, contracts, multi-product behavior, institutional authority, and current law remain separate. This page supplies a relationship measure, not a legal conclusion.
An elasticity coefficient needs an interpretation ledger
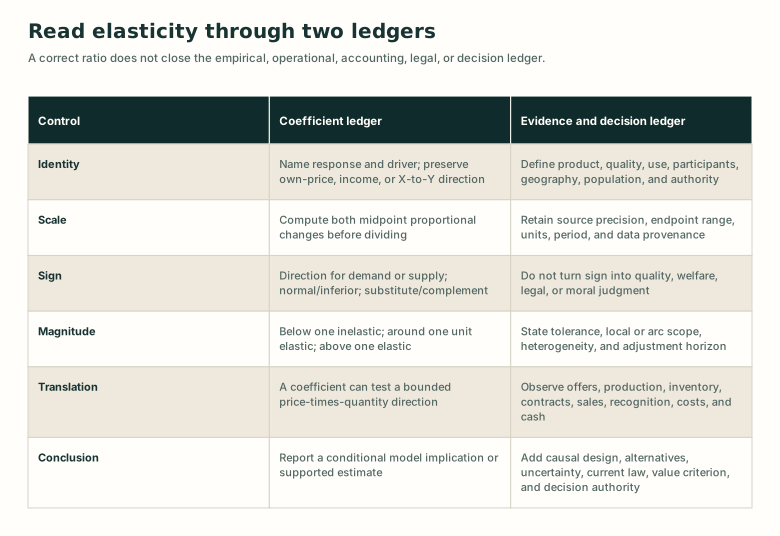
Detailed visual description
The coefficient ledger names response and driver, computes both midpoint percentage changes, preserves sign, classifies absolute magnitude, and reports a conditional result. The evidence ledger defines market scope, data provenance, adjustment horizon, causal posture, operational records, accounting events, legal authority, alternatives, uncertainty, value criteria, and decision authority.
Put the concept to work
Analyze this concept
Learning resources
Choose a lesson, try an application, or inspect the sources behind this concept.
Build on these ideas
- Demand — Analyze
To analyze this concept: Required. Another good's price is a non-own-price demand determinant whose change can shift the focal demand relationship.
- Elasticity — Analyze
To analyze this concept: Required. The response and driver require the general midpoint and sign controls.
Lessons
Worked examples and cases
Practice
Common mistaken ideas
Sources
Broader topics
Related concepts
Show 1 more related concepts
Use this idea next
- Complementary good — Analyze
Required level here: analyze. Required. A negative cross-price response is the foundational quantitative signal for complementarity.
- Substitute good — Analyze
Required level here: analyze. Required. A positive cross-price response is the foundational quantitative signal for substitution.