Return on assets relates net income for a period to the average recognized assets supporting the entity during that period. Beacon's Year 5 calculation is:
$24,000 net income ÷ $200,000 average total assets = 12% ROA
The result means twelve cents of net income per average asset dollar under the declared convention. It is not twelve cents of cash, a market return earned by an investor, or a valuation yield.
OpenStax Section 6.6 presents return on assets beside return on equity. The shared net-income numerator does not erase their different asset and equity denominators.
Expose the two operating drivers
ROA can be written as:
net income / net sales × net sales / average total assets
= net income / average total assets
Net sales cancels algebraically, leaving ROA. The cancellation separates two drivers:
- net profit margin asks how much income remains per sales dollar;
- total asset turnover asks how much sales volume is generated per average asset dollar.
Beacon's 10% margin multiplied by 1.20 turnover equals 12%. Harbor's 8% margin multiplied by 1.50 turnover also equals 12%. One result, two mechanisms.
Identity is not causality
The decomposition identifies mathematical contribution, not economic cause. It does not prove that Beacon has pricing power or that Harbor operates assets better. Those claims require product, cost, volume, capacity, age, maintenance, working-capital, and industry evidence.
Likewise, changing an accounting estimate can alter both net income and asset carrying amounts. An impairment can reduce the denominator for future periods. Acquisitions can distort a simple average. ROA must be read with the accounting history embedded in both sides.
Comparison boundaries
Negative net income produces negative ROA, but rankings around losses require care. Nonpositive assets fall outside the ordinary convention. Financial institutions and other specialized businesses may require different analytical frameworks. Cross-company comparisons also need aligned periods, policies, entity scope, and asset definitions.
ROA is useful when it narrows the next question. The Beacon–Harbor result is not a tie for “best.” Both report 12% ROA through different margin and turnover combinations. The equity denominator and leverage affect return on equity. Operating cash requires a separate comparison.
Return on assets in the learning graph
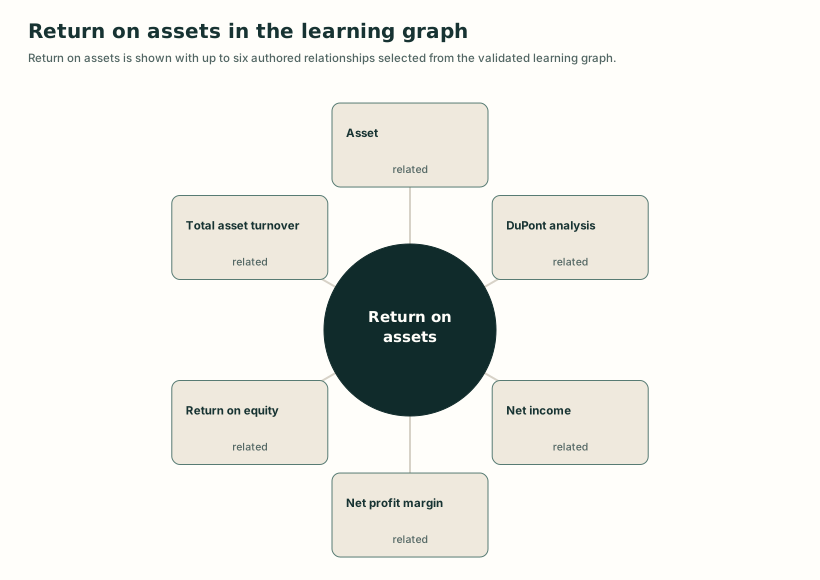
Detailed visual description
A structural map places Return on assets at the center and connects it to related concepts, prerequisite concepts, or lessons from the knowledge graph. Edge labels distinguish broader, narrower, related, prerequisite, and teaching relationships where present.
Put the concept to work
Understand this concept
- Explain ROA as same-period net income per average recognized asset dollar and distinguish the measure from cash return, market return, and unqualified operating efficiency.
Analyze this concept
- Compute and compare ROA, verify the margin-times-turnover identity, and attribute differences to mathematical drivers without inventing operational causes.
Learning resources
Choose a lesson, try an application, or inspect the sources behind this concept.
Build on these ideas
- Average balance — Understand
To understand this concept: Required. The denominator represents a stock employed across the income period.
- Net income — Understand
To understand this concept: Required. The numerator is an accrual-basis period residual rather than cash generated.
- Net profit margin — Analyze
To analyze this concept: Required. Margin supplies the income-per-sales driver of ROA.
Show 2 more prerequisites
- Return on assets — Understand
To analyze this concept: Required. Analysis depends on the ratio's declared numerator and denominator.
- Total asset turnover — Apply
To analyze this concept: Required. Turnover supplies the sales-per-average-assets driver of ROA.
Lessons
Worked examples and cases
- Align a period flow with average statement balances
- Explain Beacon and Harbor's Year 5 return difference
- Reach the same ROA through different margin and turnover
Show 1 more examples and cases
Practice
- Choose the bounded conclusion from equal ROA
- Compute asset turnover and return on assets
- Compute ROA from aligned average assets
Show 1 more practice items
Common mistaken ideas
Sources
Related concepts
Show 3 more related concepts
Use this idea next
- Equity multiplier — Apply
Required level here: understand. Required. The link to return on equity runs through return on assets.
- Return on assets — Analyze
Required level here: understand. Required. Analysis depends on the ratio's declared numerator and denominator.
- Return on equity — Analyze
Required level here: analyze. Required. ROA supplies the asset-return component of ROE.