A sample is what the analyst actually observes. Juniper's Year 1 sample has 16 invoices selected from a 480-invoice frame. The 16 settlement times are known; the mean for all 480 qualifying invoices is a population parameter that the sample may help estimate.
Selection is part of the data
Record how units entered the sample:
- probability or nonprobability selection;
- with or without replacement;
- independent units, paired units, clusters, or repeated observations;
- sample size and selection probability;
- nonresponse, substitution, or post-selection exclusion; and
- the frame and randomization mechanism used.
“We used 16 invoices” is not enough. A convenience selection of the easiest files and a simple random selection of 16 frame IDs contain the same number of rows but support different claims.
Description and inference are separate jobs
Any valid sample can be described: its mean, median, spread, and unusual observations are facts about those selected values. Generalizing beyond them requires a design and assumptions. Even a well-selected sample cannot repair a misdefined population, a bad frame, or mismeasured values.
Graduate analysis should also ask whether customers contribute several invoices. Invoice-level random selection may then produce dependent outcomes within customer clusters. The foundational Juniper packet does not establish that dependence; it names it as a condition to investigate before treating a textbook standard error as decision-grade evidence.
Sample in the learning graph
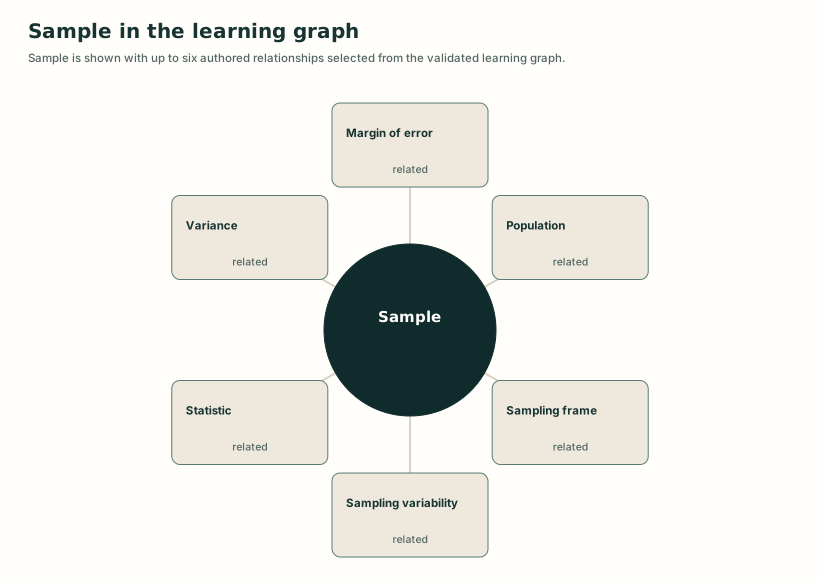
Detailed visual description
A structural map places Sample at the center and connects it to related concepts, prerequisite concepts, or lessons from the knowledge graph. Edge labels distinguish broader, narrower, related, prerequisite, and teaching relationships where present.
Put the concept to work
Understand this concept
- Explain how a sample differs from its frame and target population and why the selection design governs defensible generalization.
Analyze this concept
- Evaluate a stated sample for selection probability, independence or clustering, replacement, nonresponse, exclusions, and the conclusions the design can support.
Learning resources
Choose a lesson, try an application, or inspect the sources behind this concept.
Build on these ideas
- Population — Understand
To understand this concept: Required. A sample is interpreted relative to the population it is intended to represent.
- Sample — Understand
To analyze this concept: Required. Design evaluation applies the distinction among selected observations, frame, and target.
- Sampling frame — Understand
To understand this concept: Required. Actual selection occurs from the accessible frame.
Lessons
Worked examples and cases
Practice
Common mistaken ideas
Sources
Related concepts
Show 3 more related concepts
Use this idea next
- Sample — Analyze
Required level here: understand. Required. Design evaluation applies the distinction among selected observations, frame, and target.
- Sampling variability — Understand
Required level here: understand. Required. Different selected subsets create sampling variability.
- Statistic — Understand
Required level here: understand. Required. A statistic is a function of observed sample data.
Show 1 more next steps
- Variance — Understand
Required level here: understand. Helpful. The denominator depends on whether the observations are a sample or complete population.