The labor force equals employed plus unemployed people under the survey's definitions. With 120 employed and 5 unemployed, the labor force is 125 and the unemployment rate is 4%. The other 75 people in a 200-person reference population are outside the labor force, not in this denominator.
A falling rate can accompany employment gains, or it can accompany transitions from unemployment to outside the labor force. Conversely, a stronger search response can raise measured unemployment temporarily as people enter the labor force. Inspect levels and participation alongside the rate.
The measure does not capture every dimension of underemployment, hours, pay, security, job quality, or hardship. Preserve survey, population, seasonal adjustment, period, revisions, and alternative labor-underutilization measures.
Reconcile the population states
Suppose 95 people are employed, five are unemployed and actively seeking work, and 20 are outside the labor force. The labor force is 100 and the unemployment rate is 5%, not 25 / 120. The BLS CPS definitions control who belongs in each state and denominator. If two unemployed people stop searching, the measured rate can fall even though employment does not rise. Keep employment, unemployment, labor-force participation, and the outside-labor-force count visible before interpreting a headline change.
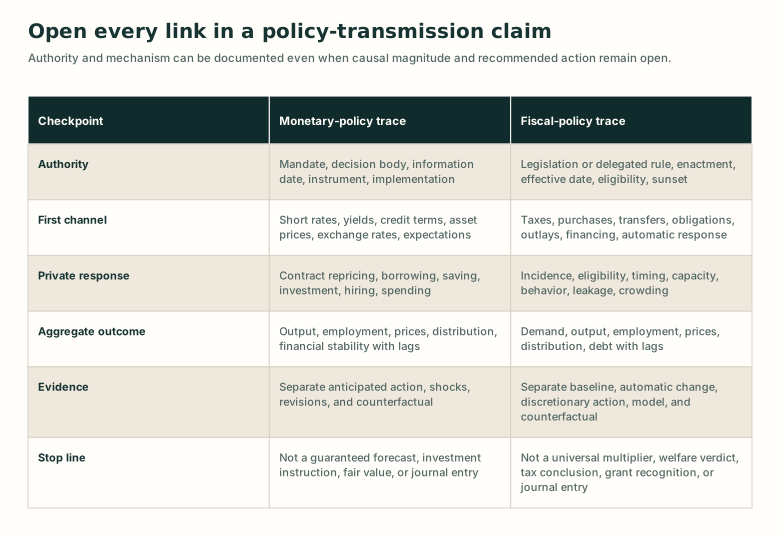
A policy arrow is a chain of testable checkpoints
Detailed visual description
The monetary column begins with mandate and instrument, then financial conditions and private contract responses. The fiscal column begins with legislation or rule, then taxes, purchases, transfers, budget timing, and private incidence. Both proceed to aggregate outcomes, require counterfactual evidence, and stop before forecasts, advice, welfare verdicts, or accounting entries.
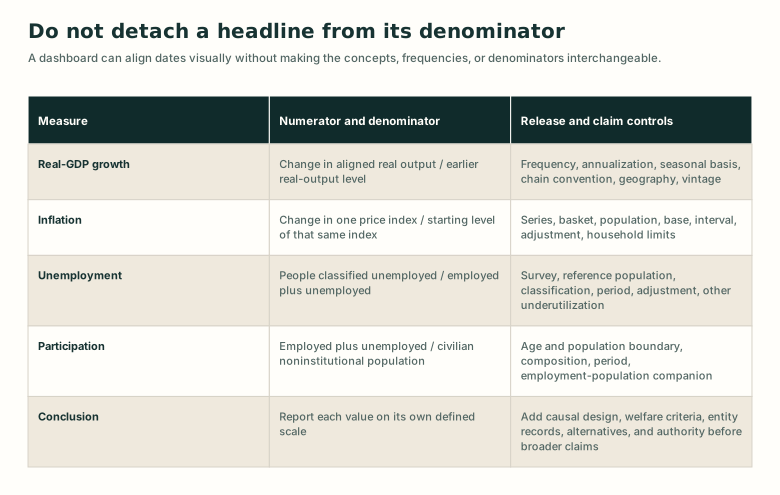
Four familiar indicators use four different comparison contracts
Detailed visual description
Real-GDP growth uses an earlier real-output level. Inflation uses the starting value of the same price index. Unemployment uses the labor force, while participation uses the civilian noninstitutional population. Each row adds frequency, adjustment, population, and release-vintage controls. The final row warns that causal, welfare, accounting, and decision conclusions require separate evidence.
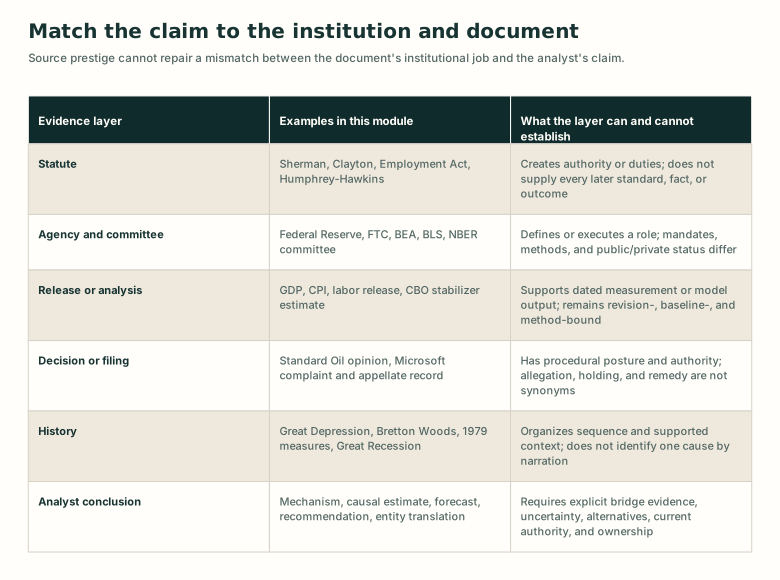
Institutions create different kinds of economic evidence
Detailed visual description
The table separates laws from institutions, statistical releases from analyses, legal complaints from holdings, and historical sequence from causal inference. The final row requires bridge evidence, uncertainty, alternatives, authority, and decision ownership for an analyst conclusion.
Put the concept to work
Analyze this concept
- Compute unemployment as unemployed divided by the labor force and explain how employment, unemployment, participation, population, and classification changes can move the rate.
Learning resources
Choose a lesson, try an application, or inspect the sources behind this concept.
Build on these ideas
- Economic analysis — Understand
To analyze this concept: Required. The rate depends on survey classifications and a bounded denominator.
Lessons
Worked examples and cases
- Audit a 2024 official release snapshot
- Evaluate the two-quarter recession rule
- Great Depression: build a multi-ledger chronology before explaining
Show 2 more examples and cases
Practice
Common mistaken ideas
Sources
Broader topics
Related concepts
Show 1 more related concepts
Use this idea next
- Labor-force participation rate — Analyze
Required level here: analyze. Helpful. Contrasting the denominators prevents a common rate substitution.